ENVIRONMENTAL SCIENCE · CHAPTER 7 REVIEW
Back From the Brink
Follow along with your worksheet, one question at a time.
mrsajdak.com/brink
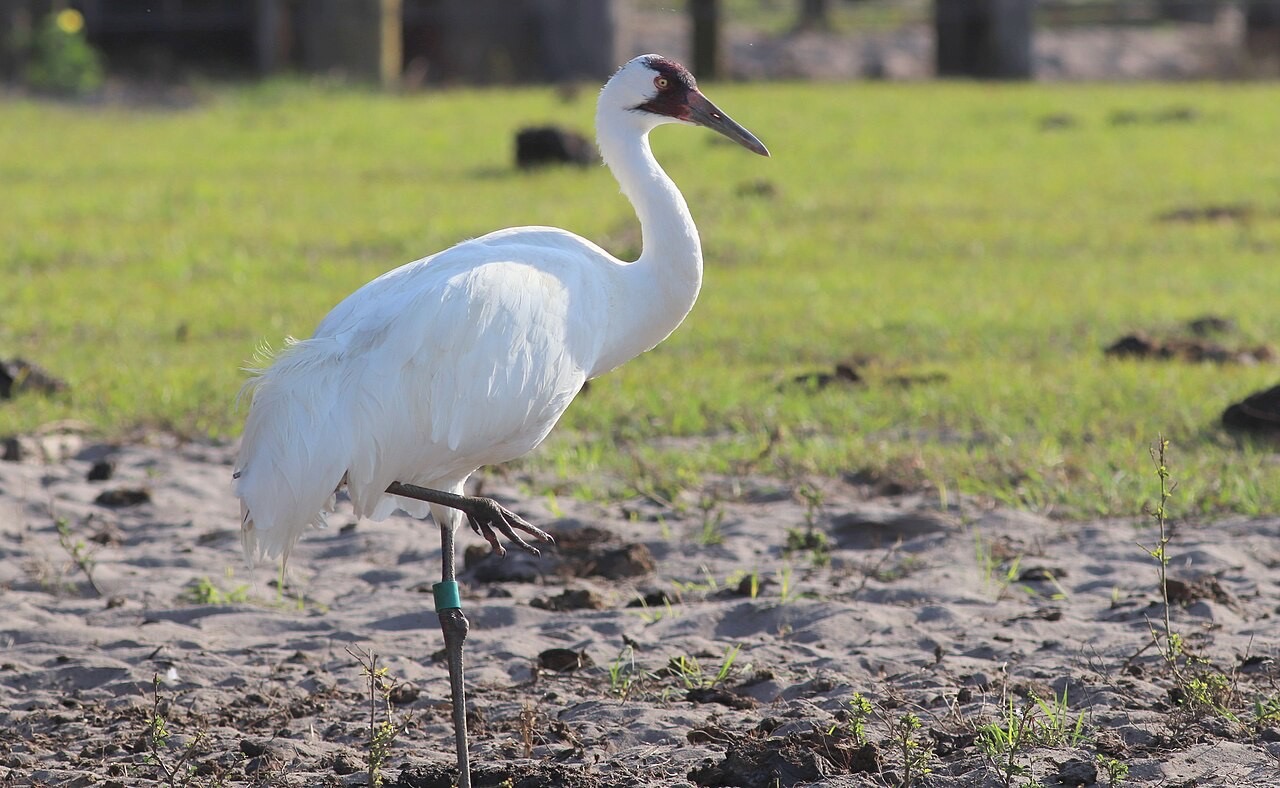
Photo: gary_leavens, CC BY-SA 2.0
START HERE · PICK AN OPENER
Choose how to open the lesson
Click a card to jump to it. Every option ends at the same Observe, Wonder, Predict slide and the same driving question.
OPTION A · VIDEO
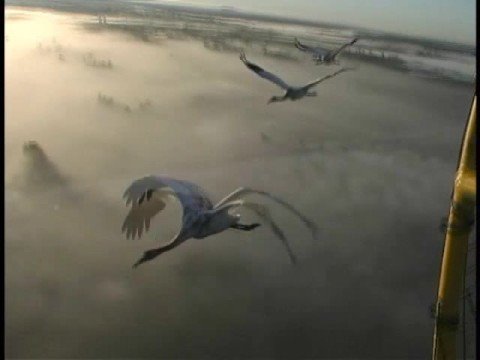
Follow the Plane
Clip 1 is Operation Migration: young cranes raised by people fly behind an ultralight plane from Wisconsin toward Florida. Clip 2 is a KTLA 5 report from a condor refuge near Bakersfield.
Watch for
Why would people teach a bird to follow a plane?
Clip 2: what are people doing for the condors?
Do you think these birds would be here without people? Why?
Videos on YouTube: Operation Migration; KTLA 5.
OPTION B · TRY IT · 4 MINUTES
Rank the Threats
1
Get the six threat cards with a partner.
2
Read each card out loud.
3
Put them in a line: the biggest threat to wild species first.
4
Be ready to defend your first card.
You need
One set of six threat cards per pair: habitat loss, invasive species, population growth, pollution, climate change, overexploitation (overhunting and overfishing)
A pencil
Watch for
Which card did most pairs put first?
Scientists rank habitat loss first and invasive species second.
Which threats can make each other worse?
OPTION C · PHOTOS
Phenomenon: Two Birds, Two Endings
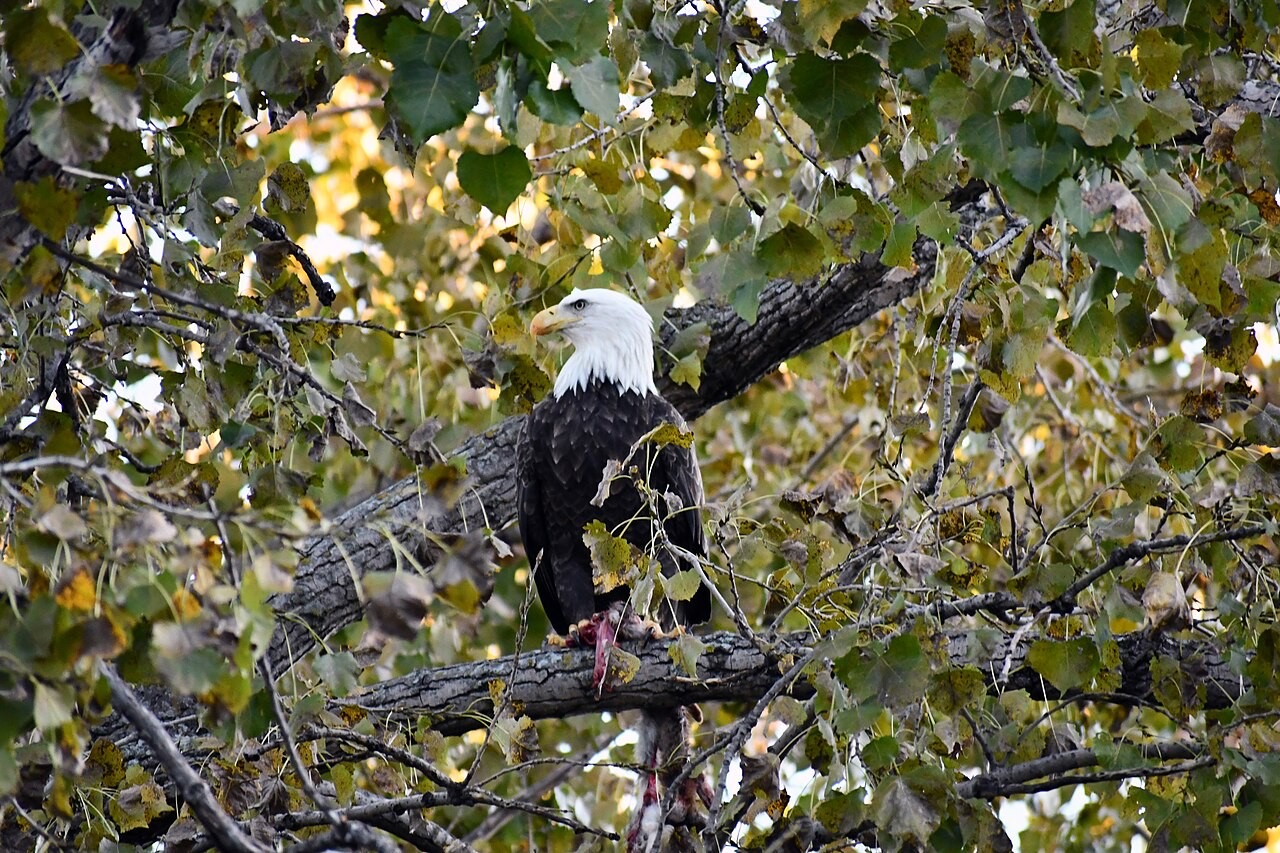
Photos: gary_leavens, CC BY-SA 2.0 · Grand Canyon National Park, CC BY 2.0
START HERE
Observe, wonder, predict
Some species fell to a few dozen animals. Some of them are climbing back.
OBSERVEWhat do you notice about these animals and their numbers?
WONDERWhat do you wonder about why they fell so low?
PREDICTWhich works best: a law, a refuge, or breeding them in a zoo?
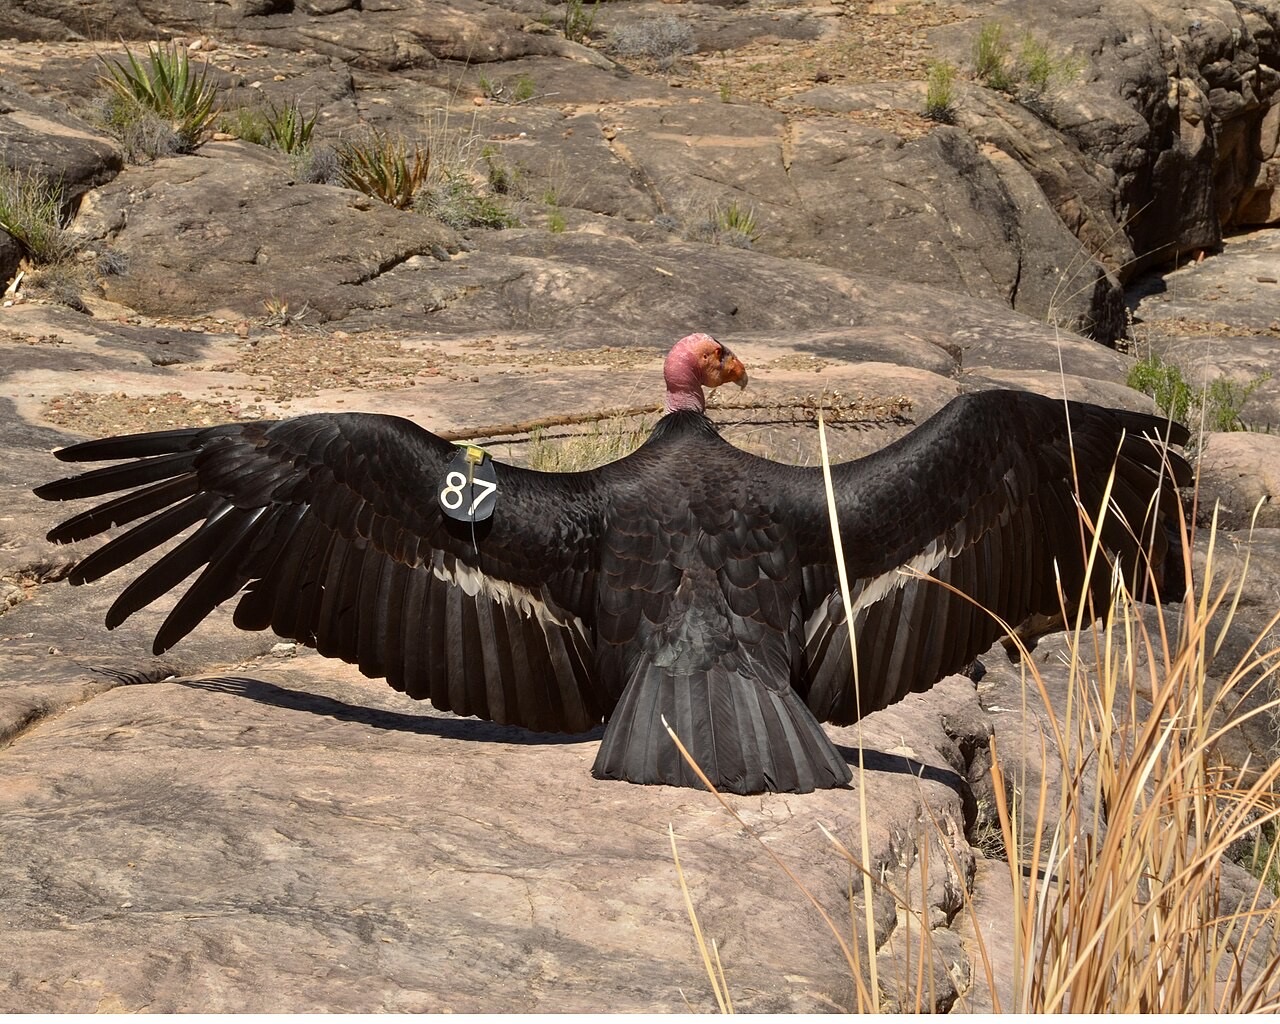
A tagged California condor at the Grand Canyon.
Photo: Grand Canyon National Park, CC BY 2.0
DRIVING QUESTION
Why do species disappear, and what does it take to bring one back?
START HERE
What Happened Here?
Finished observing? Click here to find out.
People pushed both birds toward extinction, and people brought them back. But each one came back a different way, because each one was in trouble for a different reason.
Today, you will use the real U.S. endangered species list, open seven case files, and read the real counts of four species that came back.
TAB 1 · QUESTIONS 1 TO 5
Part 1. The list
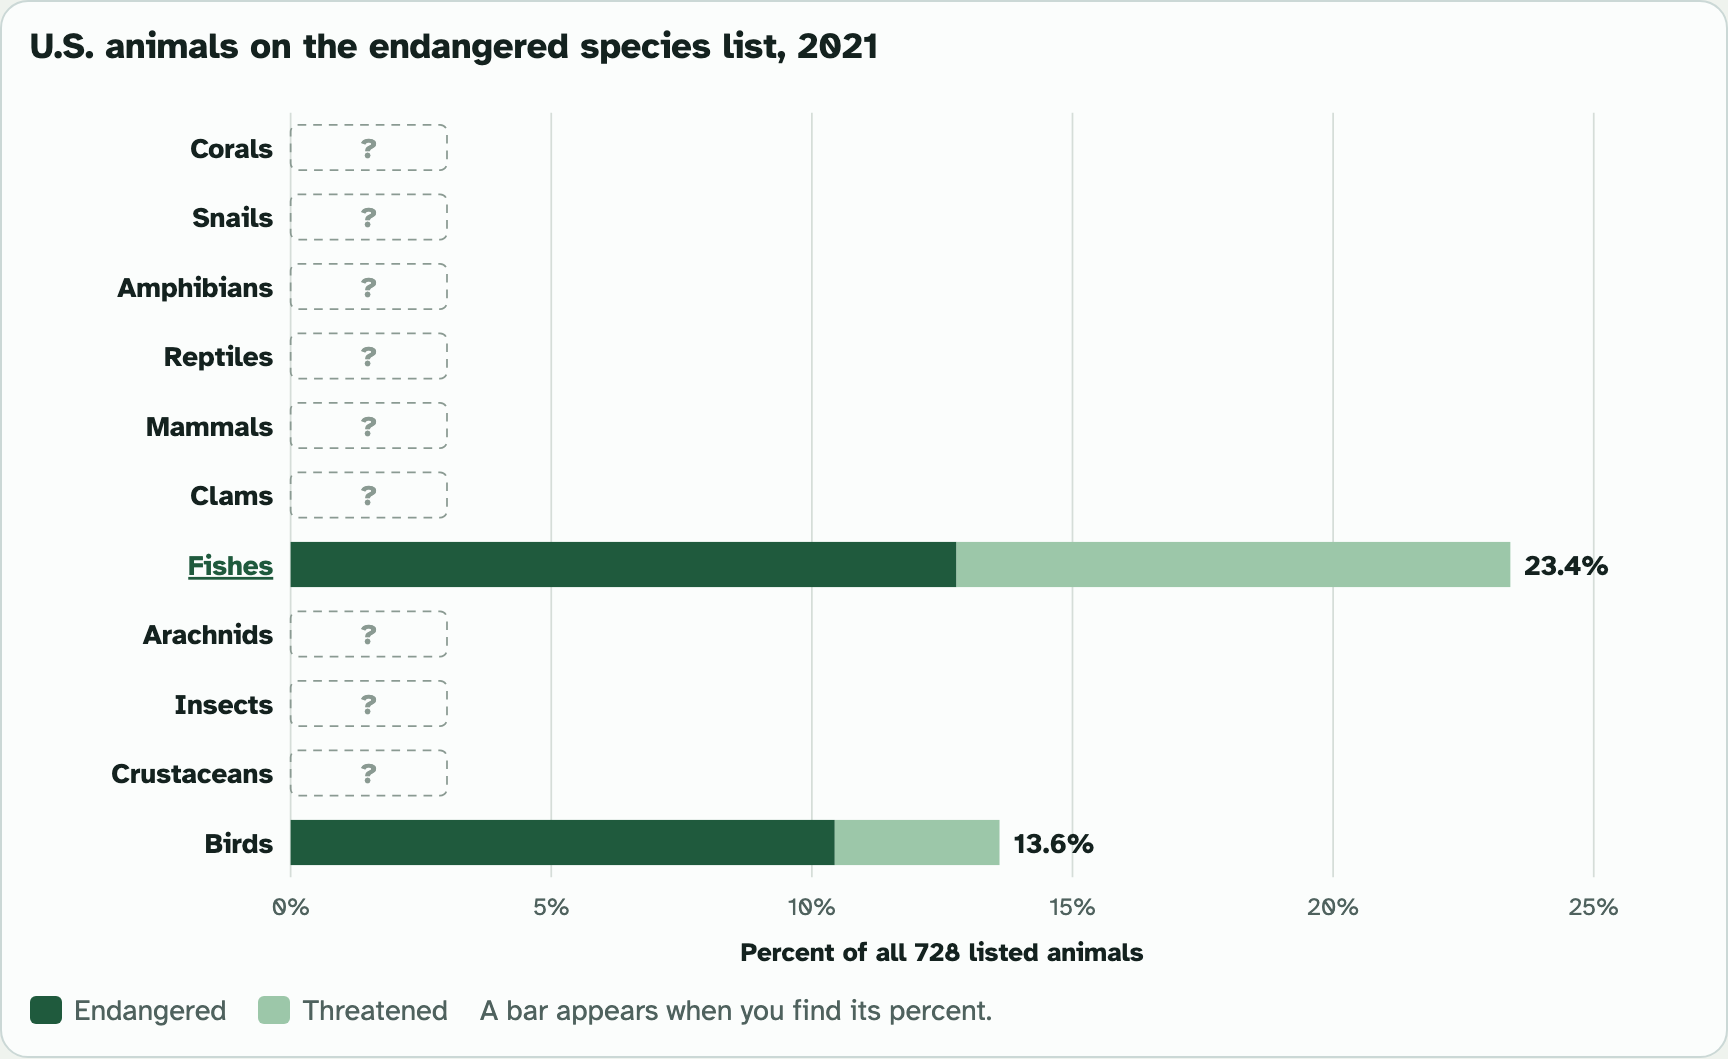
728 kinds of U.S. animals are on the list. Which groups fill it?
Photo: U.S. Fish and Wildlife Service, public domain
PART 1 · QUESTION 1
A percent: part of the whole
THE MATH
Divide, then times 100
Part ÷ whole × 100.
Round to one number after the dot.
Example
A class has 25 students. 6 play soccer.
6 ÷ 25 × 100
= 24.0% play soccer
These are not your numbers. Use your own.
PART 1 · QUESTIONS 1 AND 2
Build the bar model
1
Pick a group.
2
Total ÷ 728 × 100. Round to the tenth.
3
Press Check. The bar appears.
4
Do all six groups in your table.
5
Answer Questions 1 and 2.
PART 1 · LEARN IT · 1 OF 5
Endangered or threatened?
An endangered species has so few left that it could soon go extinct. A threatened species has enough left for now. But its numbers are falling, so it is likely to become endangered.
Photo: gary_leavens, CC BY-SA 2.0
PART 1 · LEARN IT · 2 OF 5
Who makes the list
In the United States, the Endangered Species Act (ESA) makes the list. The U.S. Fish and Wildlife Service lists land and freshwater species. NOAA Fisheries lists ocean species. A species gets listed on biology alone: how many are left, where they live, and what threatens them. Cost does not count.
PART 1 · LEARN IT · 3 OF 5
What your bars show
Fishes are the biggest share of the list. Most listed fishes and almost all listed clams (freshwater mussels) live in rivers and lakes. Dams, pollution and invasive zebra mussels hit fresh water hard.
Screenshot of the lab
PART 1 · LEARN IT · 4 OF 5
Comparing groups of different sizes
A big group can have many listings and still be less in danger than a small one. To compare, use a percent: endangered ÷ total × 100. Example: a group with 30 listings, 15 of them endangered. 15 ÷ 30 × 100 = 50% endangered.
PART 1 · LEARN IT · 5 OF 5
Your bars are a model
A graph is a model of the data. Each bar stands for one group's share of the list. Every model leaves things out, so scientists always ask what a model cannot show.
Screenshot of the lab
PART 1 · QUESTIONS 3 TO 5
Use the idea
QUESTION 3
Endangered or threatened?
Tick the word for each description.
QUESTION 4
Clams or fishes?
Endangered ÷ total × 100 for each.
Which group is more in danger?
QUESTION 5
Model check
What does each bar stand for?
Name one thing the model leaves out.
TAB 2 · QUESTIONS 6 TO 10
Part 2. The cause
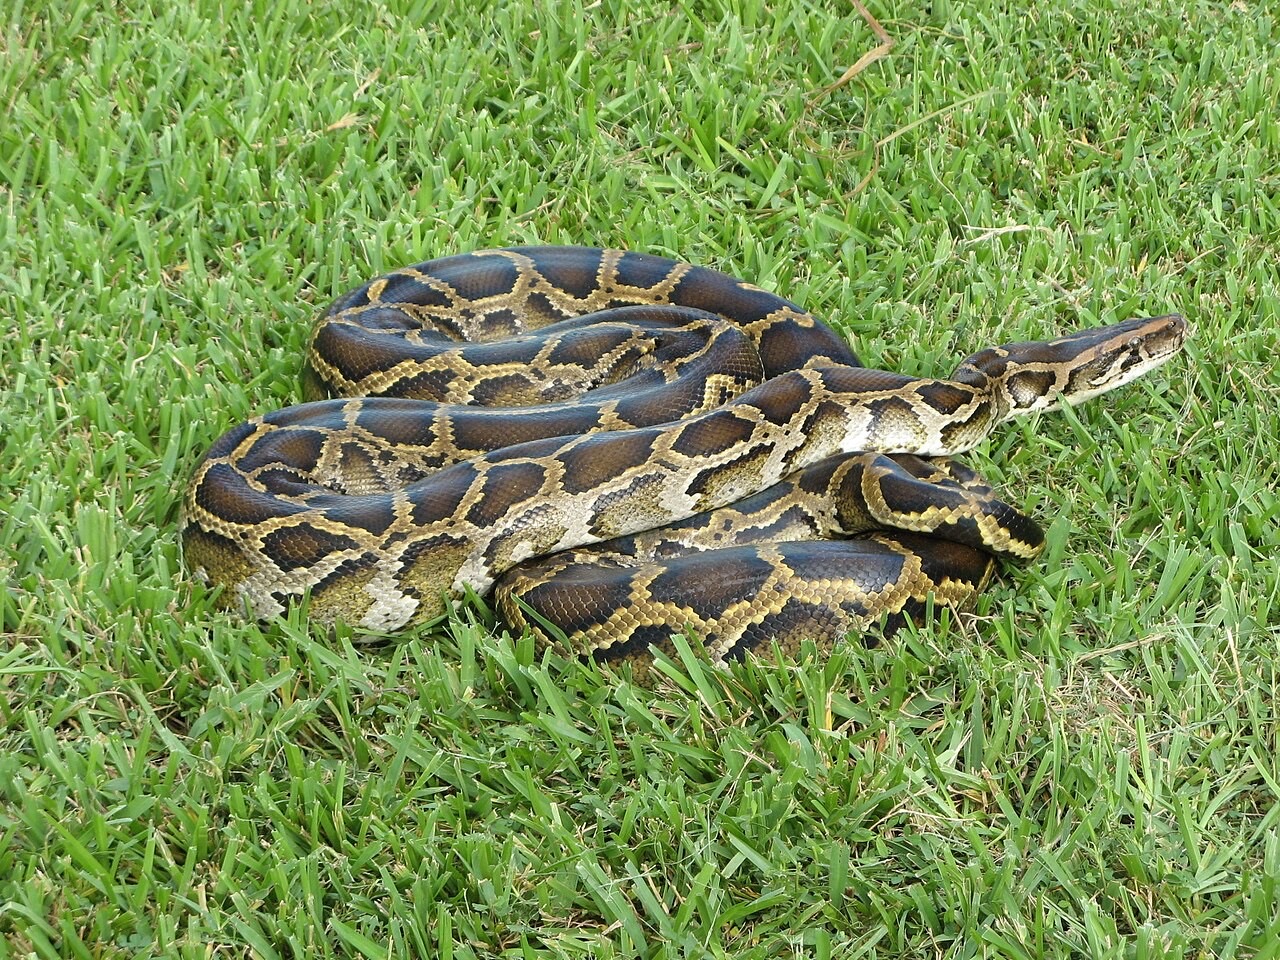
Seven real species. Seven case files. What pushed each one down?
Photo: U.S. Fish and Wildlife Service, public domain
PART 2 · QUESTIONS 6 AND 7
Open the case files
1
Open every case, A to G.
2
Read the big number on each one.
3
Answer Questions 6 and 7.
PART 2 · LEARN IT · 1 OF 4
Extinction is natural. The rate is not.
A species goes extinct when none are left anywhere on Earth. Normally, fewer than 1 species in a million is lost each year. That is the background extinction rate. Today, species are lost at least 1,000 times faster. Earth has had five mass extinctions, caused by volcanoes and asteroids. Scientists think a sixth has started, and this time people are the cause.
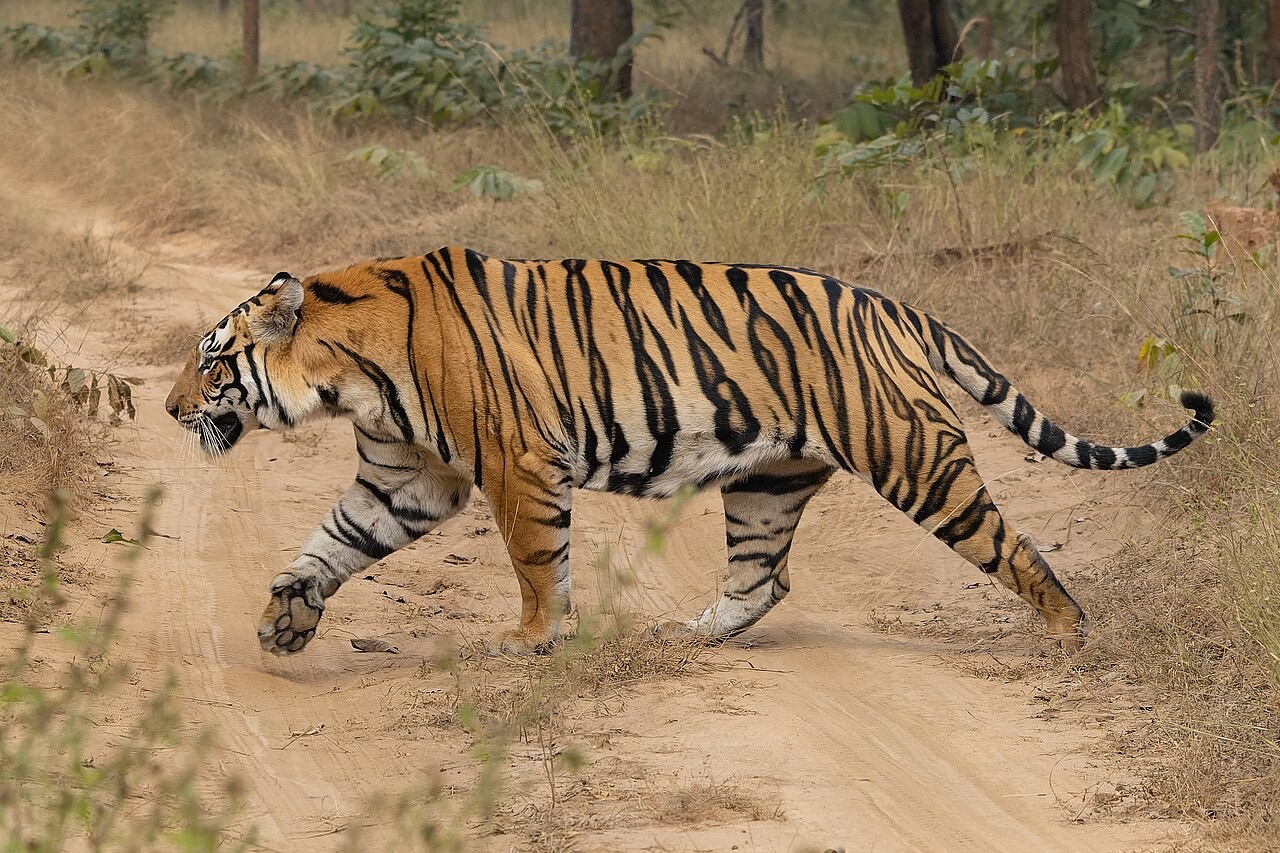
Photo: Tisha Mukherjee, CC BY-SA 4.0
PART 2 · LEARN IT · 2 OF 4
HIPPCO: six human causes
Habitat loss: homes destroyed, damaged or cut into pieces (habitat fragmentation). The greatest threat.
Invasive species: a species brought to a new place that harms it. The second greatest threat.
Population growth: more people use more land and more resources.
Pollution: poisons in the water, soil and air.
Climate change: warming melts ice and moves the places a species can live.
Overexploitation: taking too many, by hunting, poaching, fishing or the pet trade.
PART 2 · LEARN IT · 3 OF 4
Poison that builds up
A chemical like the bug spray DDT stays in an animal's fat. That is bioaccumulation. Each step up a food chain eats many of the step below, so the poison gets stronger. That is biomagnification. In one New York food chain: 0.04 parts per million in plankton, 25 in fish-eating birds.
Photo: U.S. Fish and Wildlife Service, public domain
PART 2 · LEARN IT · 4 OF 4
Usually more than one cause
Population growth is often the reason behind the others: more people means more farms, roads and trade. And many species face several causes at once. Scientists call that a "perfect storm."
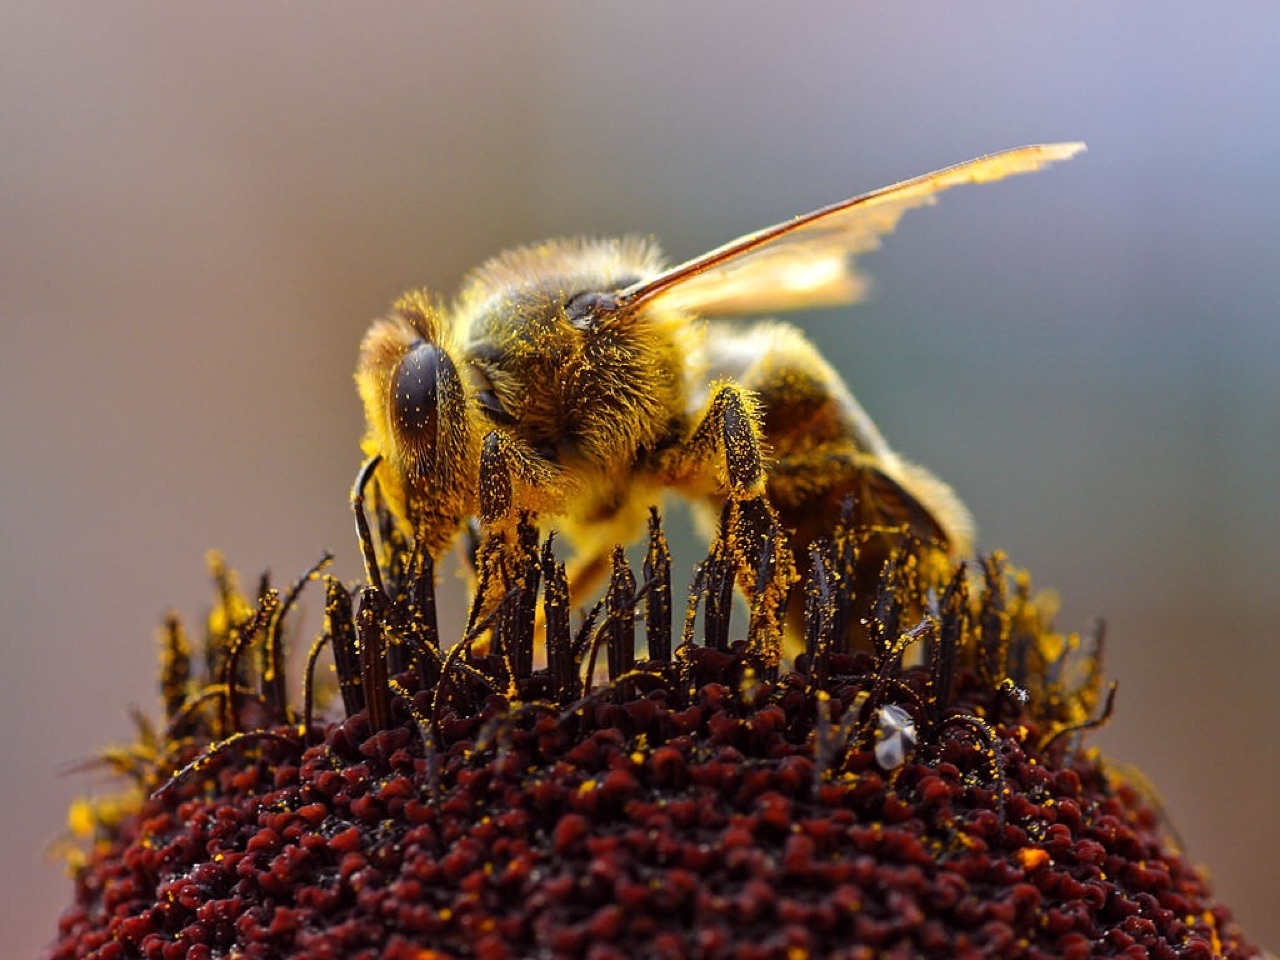
Photo: Jon Sullivan, public domain
PART 2 · QUESTIONS 8 TO 10
Use the idea
QUESTION 8
Name the cause
One HIPPCO cause for each case, A to F.
Each cause is used once.
QUESTION 9
The honeybee
Case G has three causes.
Tick all three.
QUESTION 10
The biggest threats
Which cause is the greatest threat?
Which is second?
TAB 3 · QUESTIONS 11 TO 15
Part 3. The comeback
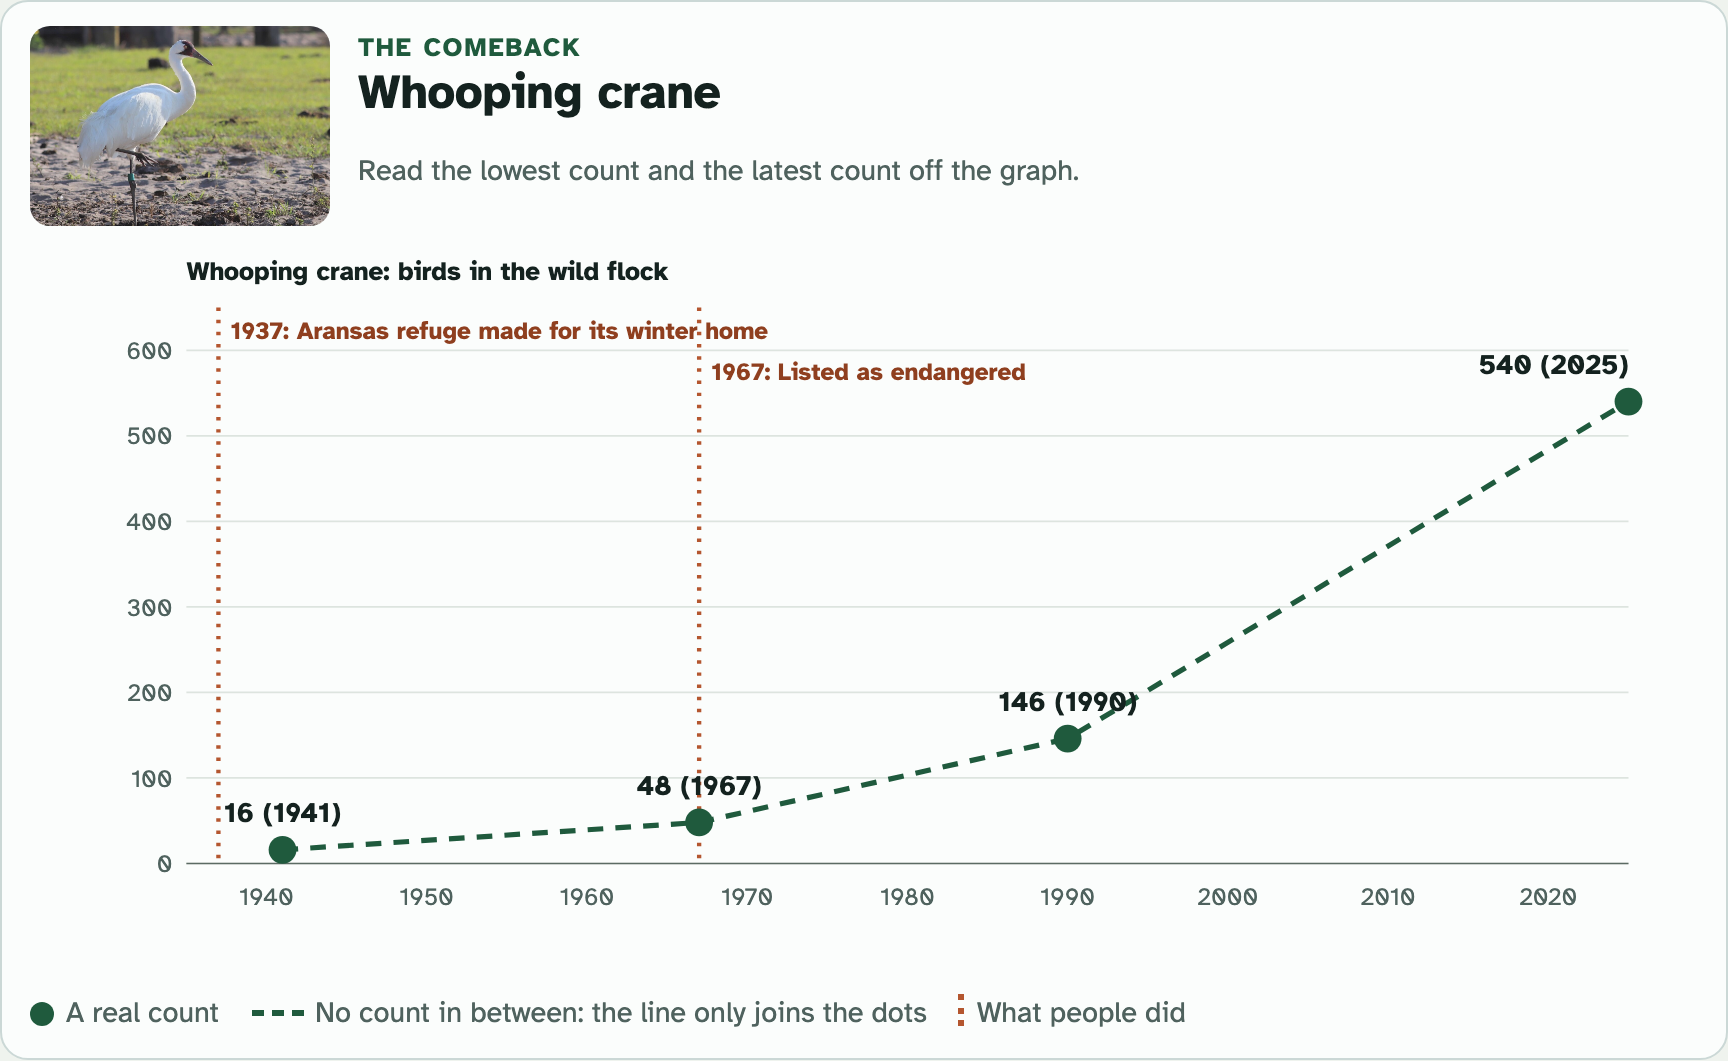
Four species that were close to gone. Each dot is a real count.
Photo: Grand Canyon National Park, CC BY 2.0
PART 3 · QUESTION 11
Times larger
THE MATH
Latest ÷ lowest
Use the lowest count, not the first one.
Round to one number after the dot.
Example
A town had 40 trees at its lowest. Now it has 300.
300 ÷ 40
= 7.5 times larger
These are not your numbers. Use your own.
PART 3 · QUESTIONS 11 AND 12
Read the comeback graphs
1
Pick a species.
2
Read the lowest and latest counts.
3
Latest ÷ lowest. Press Check.
4
Do all four.
5
Answer Questions 11 and 12.
PART 3 · LEARN IT · 1 OF 6
Laws
The ESA protects listed species and the places they live, and bans harming or selling them in the U.S. CITES is a treaty between 183 countries that bans trade in endangered species and their parts, like rhino horn. A law can also ban a poison: the U.S. banned DDT in 1972. A law only works when it is enforced.
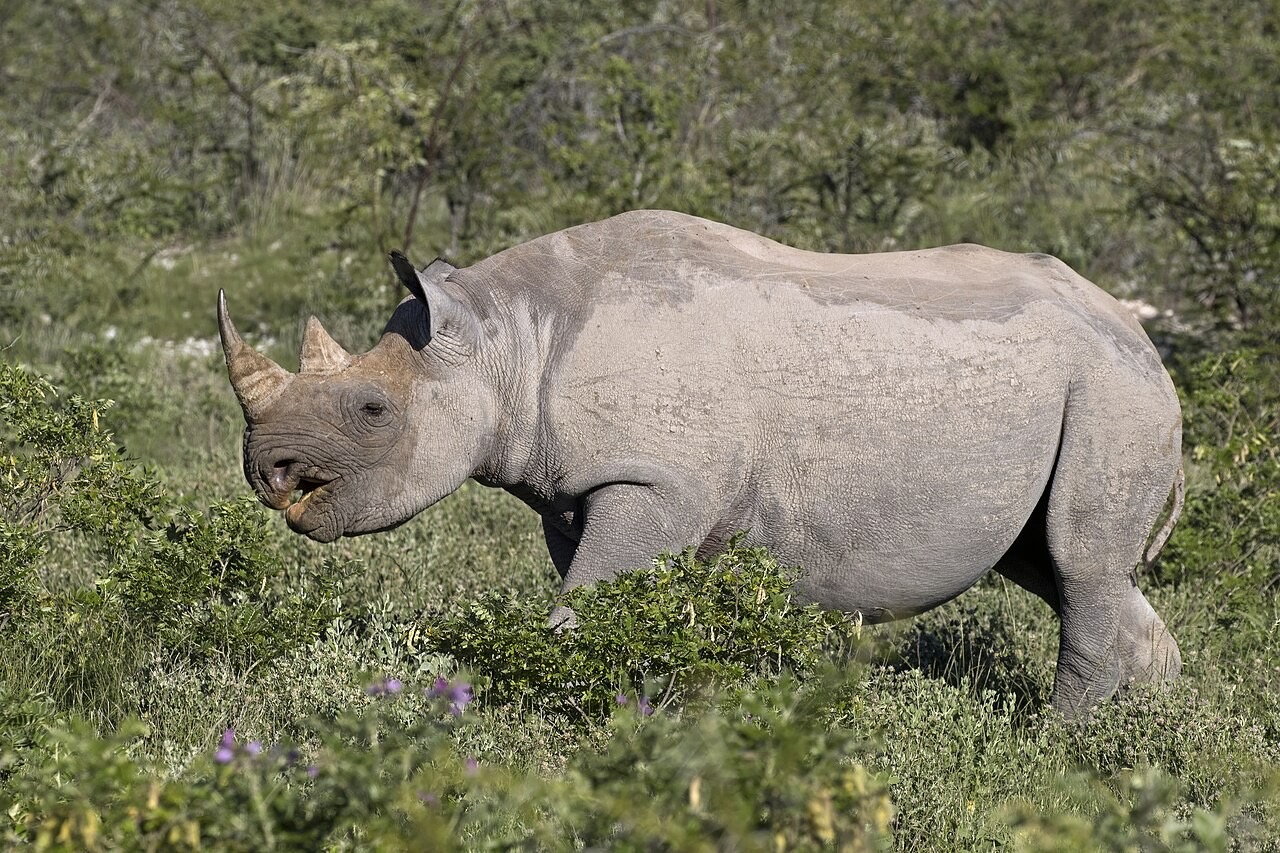
Photo: Charles J. Sharp, CC BY-SA 4.0
PART 3 · LEARN IT · 2 OF 6
Protected land
One key to saving a species is protecting where it lives. National wildlife refuges, national parks and wilderness areas keep habitat safe.
Photo: gary_leavens, CC BY-SA 2.0
PART 3 · LEARN IT · 3 OF 6
Captive breeding and egg pulling
In captive breeding, zoos and centers raise animals and release the young into the wild. In egg pulling, biologists take eggs from wild nests and hatch them in captivity. The wild pair often lays more eggs.
Photo: Grand Canyon National Park, CC BY 2.0
PART 3 · LEARN IT · 4 OF 6
Saving plants
A seed bank keeps seeds cold and dry for many years. Botanical gardens and arboretums (gardens of trees) grow and study rare plants.
PART 3 · LEARN IT · 5 OF 6
Stability and change
A population grows when more are born than die. Protection tips that balance. But a comeback is slow: big animals have few young, so it takes decades.
Screenshot of the lab
PART 3 · LEARN IT · 6 OF 6
Match the fix to the cause
A fix works best when it removes the cause. Captive breeding makes more condors. But lead from bullet fragments in the animals they eat still poisons condors in the wild.
Photo: Grand Canyon National Park, CC BY 2.0
PART 3 · QUESTIONS 13 AND 14
Use the idea
QUESTION 13
Which fix did the most?
Use the orange lines on each graph.
One fix for each species.
QUESTION 14
Is the black rhino back?
6,487 ÷ 65,000 × 100.
Compare with its old number.
ARGUE IT · QUESTION 15
"Captive breeding alone can save the California condor."
Claim
Do you agree or disagree?
Evidence
What did the condor graph show? What still happens in the wild?
Reasoning
Say when a fix works best.
WRAP IT UP · BACK TO THE START
Revisiting the Phenomenon
Why do species disappear, and what does it take to bring one back?
EVIDENCEName the HIPPCO cause for two of the species in the lab.
EVIDENCEWhich comeback grew the most times over?
EVIDENCELook back at your Predict. Was it right? Why?
Hand in your worksheet.
Next: the Chapter 7 quiz.