ENVIRONMENTAL SCIENCE · CHAPTER 7
Extinction Evidence
Follow along with your worksheet, one question at a time.
mrsajdak.com/extinction
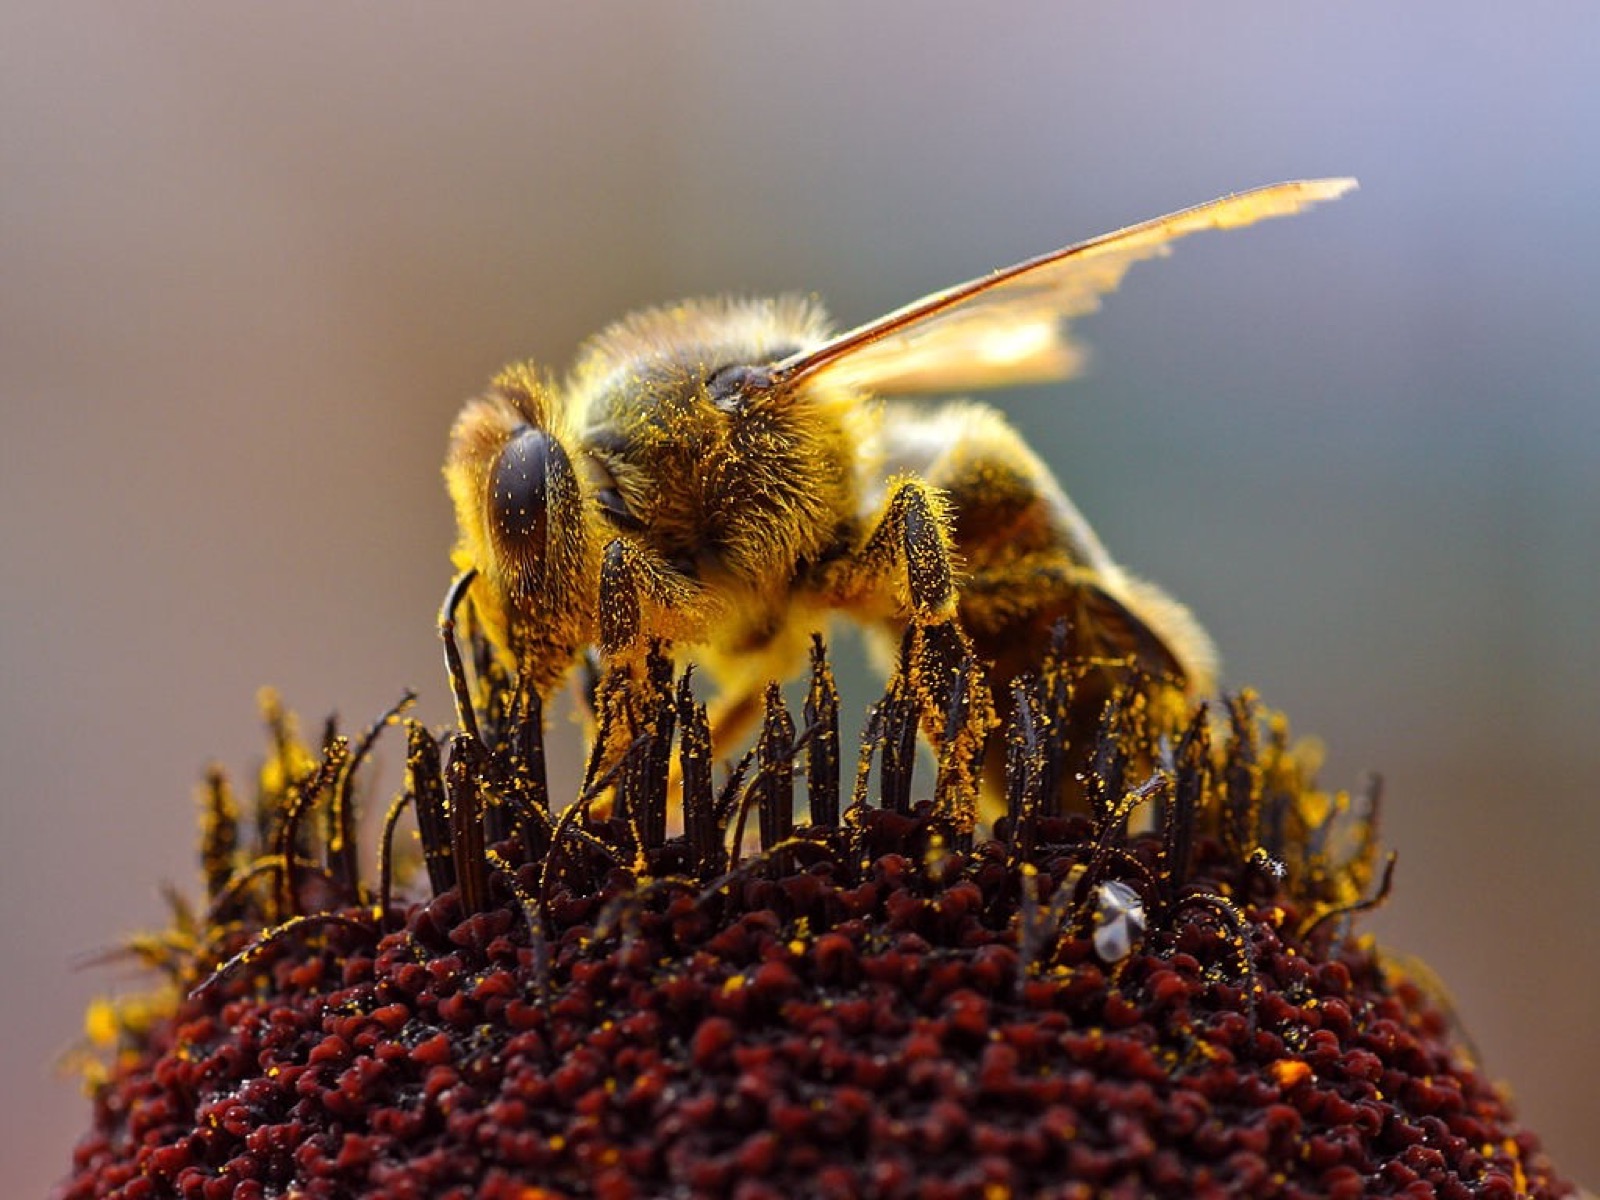
Photo: Jon Sullivan, public domain
START HERE · PICK AN OPENER
Choose how to open the lesson
Click a card to jump to it. Every option ends at the same Observe, Wonder, Predict slide and the same driving question.
OPTION A · VIDEO
Forty Million Almond Trees
Clip 1 is PBS on pollinating 40 million almond trees. Clip 2 is an AP news report on colonies collapsing. Clip 3 is rare footage of a wild bee, the rusty patched bumble bee, from Clean Wisconsin.
Watch for
How do the almond flowers get pollinated?
What did beekeepers find when they opened their hives?
Clip 3: is this wild bee in more danger than the honeybee? Why might that be?
Videos on YouTube: PBS; AP Archive; Clean Wisconsin.
OPTION B · TRY IT · 4 MINUTES
Breakfast Without Bees
1
Get a food card with a partner.
2
Cross out every food that needs bees or other insects to carry pollen.
3
Circle the foods that grow without them.
4
Count what is left. Would you want to eat this way?
You need
One food card per pair (apples, almonds, blueberries, cranberries, cucumbers, cherries, pumpkins, watermelon, wheat bread, rice, corn, oatmeal)
A pencil
Watch for
Most fruits and nuts need bees.
Wheat, rice, corn and oats are grains. They do not need insects: wind or their own flowers do the job.
What would a grocery store look like with far fewer bees?
OPTION C · PHOTOS
Phenomenon: Two Bees
Photos: Jon Sullivan, public domain · Jill Utrup, U.S. Fish and Wildlife Service, public domain
START HERE
Observe, wonder, predict
Each winter, U.S. beekeepers open their hives and find 30 to 45 out of every 100 colonies gone. The bees just vanish.
OBSERVEWhat is the bee in Photo A carrying? Where is it?
WONDERWhat do you wonder about where the bees went?
PREDICTWhich bee is more likely to go extinct? Why?
Photo A. A honeybee.
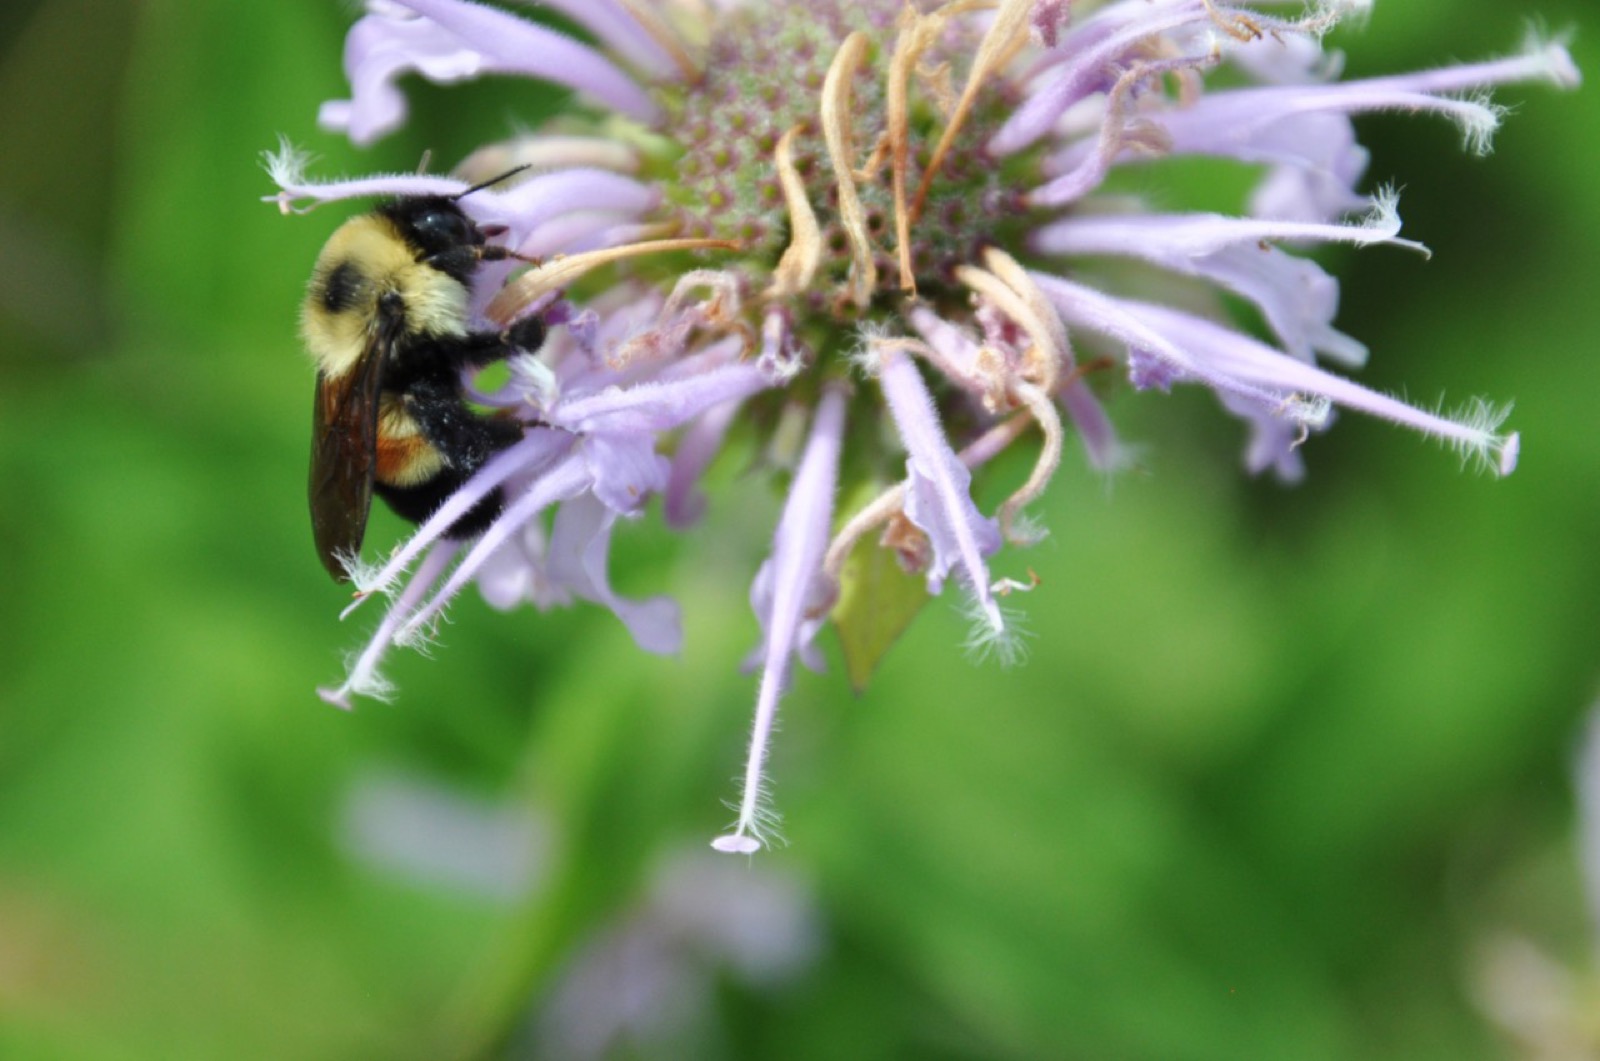
Photo B. A rusty patched bumble bee.
Photos: Jon Sullivan, public domain · Jill Utrup, U.S. Fish and Wildlife Service, public domain
DRIVING QUESTION
What makes a species disappear, and is it happening faster now?
START HERE
What Happened Here?
Finished observing? Click here to find out.
Honeybee colonies are collapsing: mites, viruses, pesticides, fewer wildflowers and the stress of being trucked from farm to farm all play a part, and they work together. But beekeepers replace lost hives, so honeybees are not close to extinction. The wild rusty patched bumble bee has no keepers. It was listed as endangered in 2017.
Watched the video or tried it? Click here.
Bees carry pollen from flower to flower, so plants can make fruit and seeds. Bee pollination adds more than $15 billion a year to U.S. crops, and bees pollinate about one-third of the U.S. food supply. Grains like wheat and rice do not need them.
Today, you will read the evidence for five mass extinctions in the rocks. You will compare real counts of animals lost since 1900 with the natural rate. Then you will shrink a habitat in a model and see who wins and who loses.
BEFORE YOU START
What you will learn
I can
explain how a change in environmental conditions can drive a species to extinction.
I can
compare the background extinction rate with the rate since 1900.
I can
tell an endangered species from a threatened one and name traits that put a species at risk.
BEFORE YOU START
Get set up
1
Do the Do Now at the top of your sheet.
2
Open mrsajdak.com/extinction.
3
Keep your pencil and your sheet beside you.
4
Everything you pick goes in a log. Copy from the log.
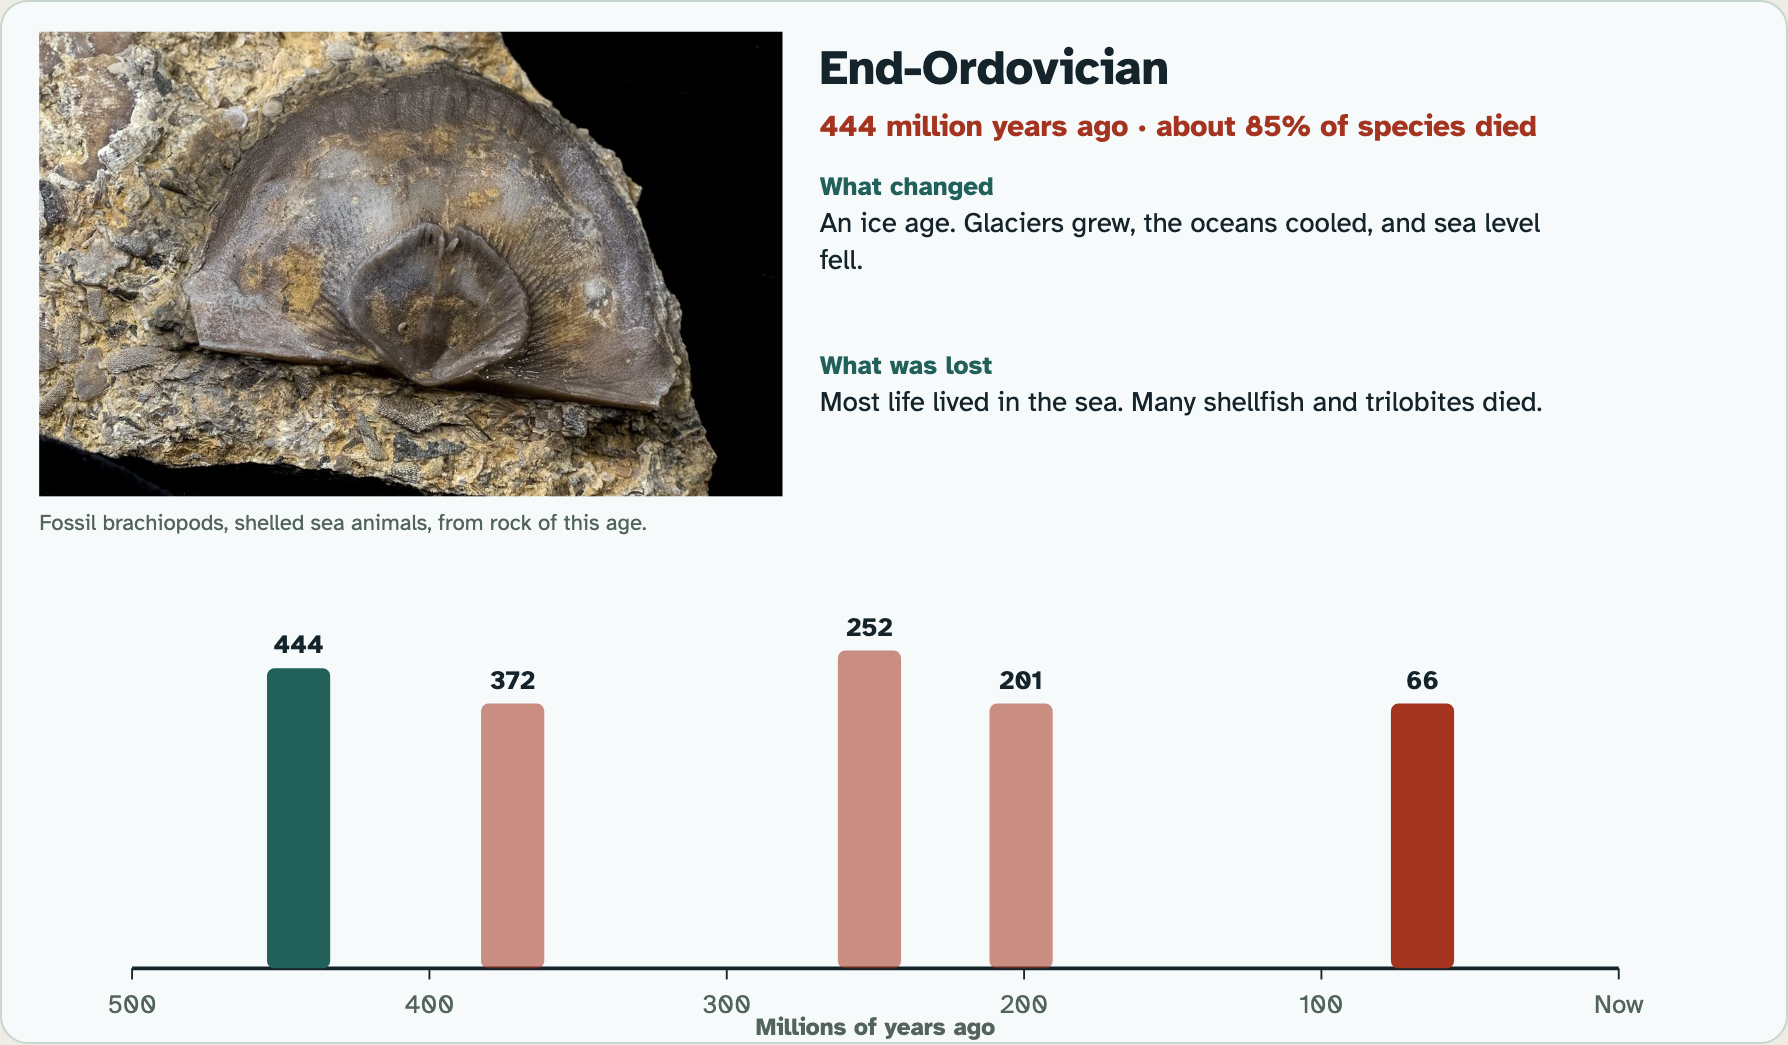
Screenshot: mrsajdak.com/extinction, Tab 1
TAB 1 · QUESTIONS 1 TO 6
Part 1. The Big Five
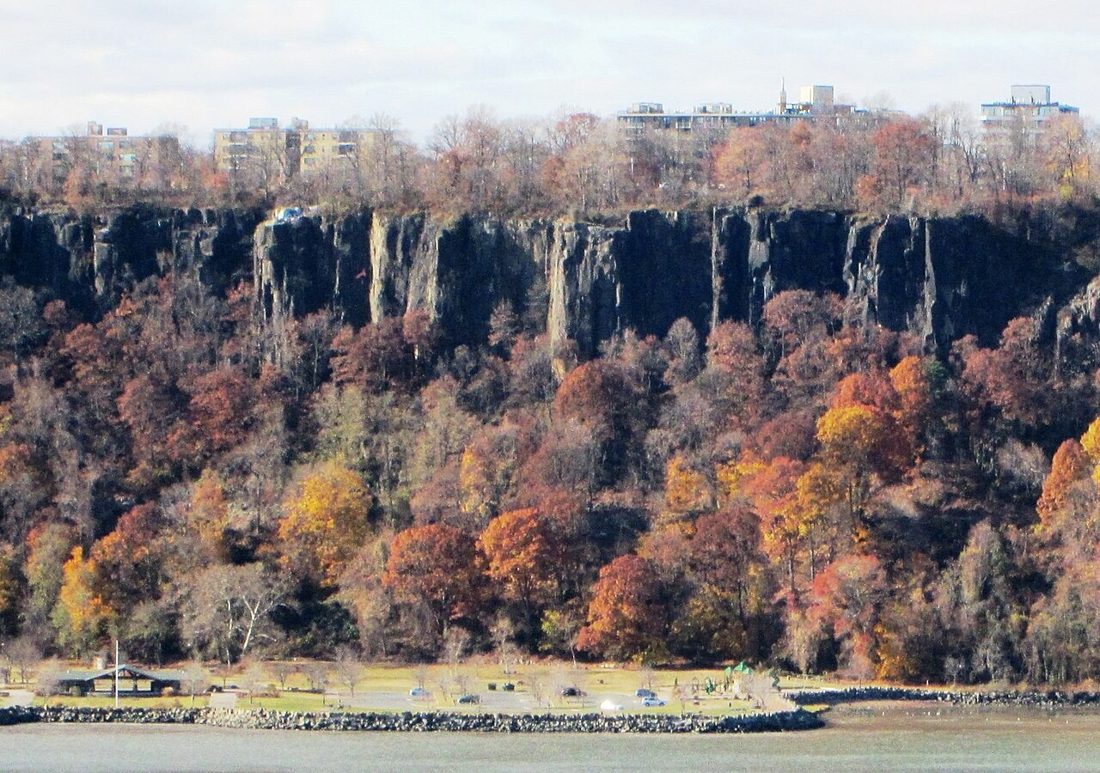
These cliffs on the Hudson River are lava rock.
They cooled from giant eruptions 201 million years ago, when most species on Earth died.
Photo: Beyond My Ken, CC BY-SA 4.0
PART 1 · QUESTIONS 1 TO 3
Five mass extinctions
1
Tap a bar on the timeline.
2
Read what changed, and look at the fossil.
3
Copy the row into Question 1.
4
Do all five.
PART 1 · LEARN IT · 1 OF 3
How a species goes extinct
Every species fits the conditions where it lives.
When the conditions change, some members cannot survive or have young.
If no members can adapt and reproduce, the species is extinct. Gone for good.
PART 1 · LEARN IT · 2 OF 3
Five times, the whole planet changed
You logged five mass extinctions. In each one, about 75% to 90% of species died.
Each came after a global change in conditions: an ice age, oceans that lost their oxygen, giant volcanoes, an asteroid.
Cause and effect: the conditions changed first. Then the species died.
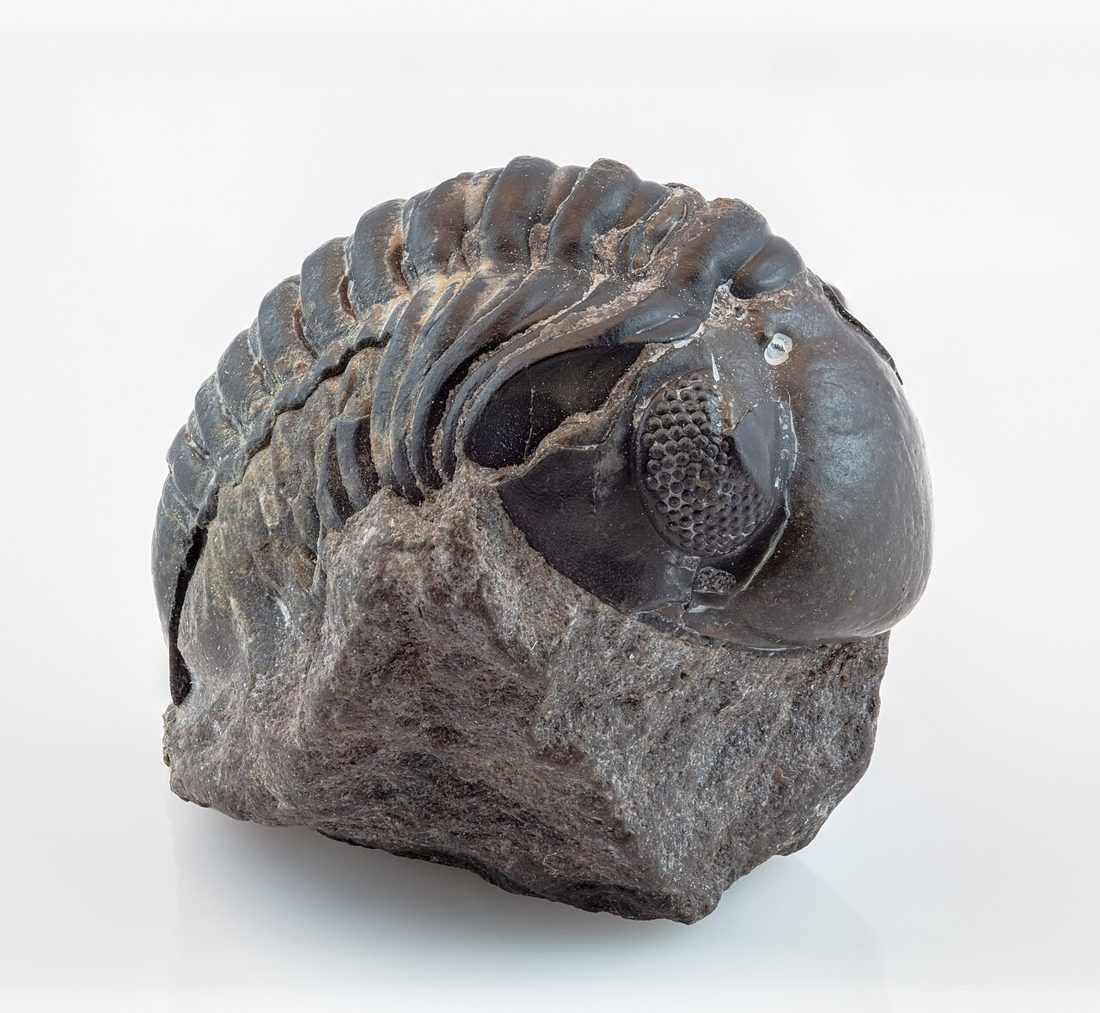
Photo: Diego Delso, CC BY-SA 4.0
PART 1 · LEARN IT · 3 OF 3
After a mass extinction
Some species survive. Over time they fill the empty places to live.
After the dinosaurs died 66 million years ago, mammals spread out into many new kinds.
But each recovery took several million years.
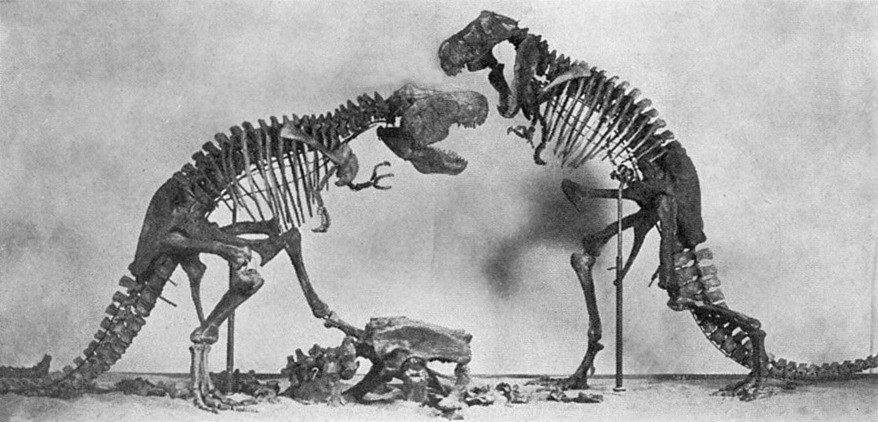
Photo: author unknown, public domain
PART 1 · QUESTIONS 4 TO 6
Cause, then effect
QUESTION 4
2 words
Name it
Every member gone.
Many species, a short time.
QUESTION 5
2 verbs
Why a species ends
What can the members not do
when conditions change?
QUESTION 6
Recovery
After the dinosaurs
Who spread out?
How long did it take?
TAB 2 · QUESTIONS 7 TO 11
Part 2. How fast now?
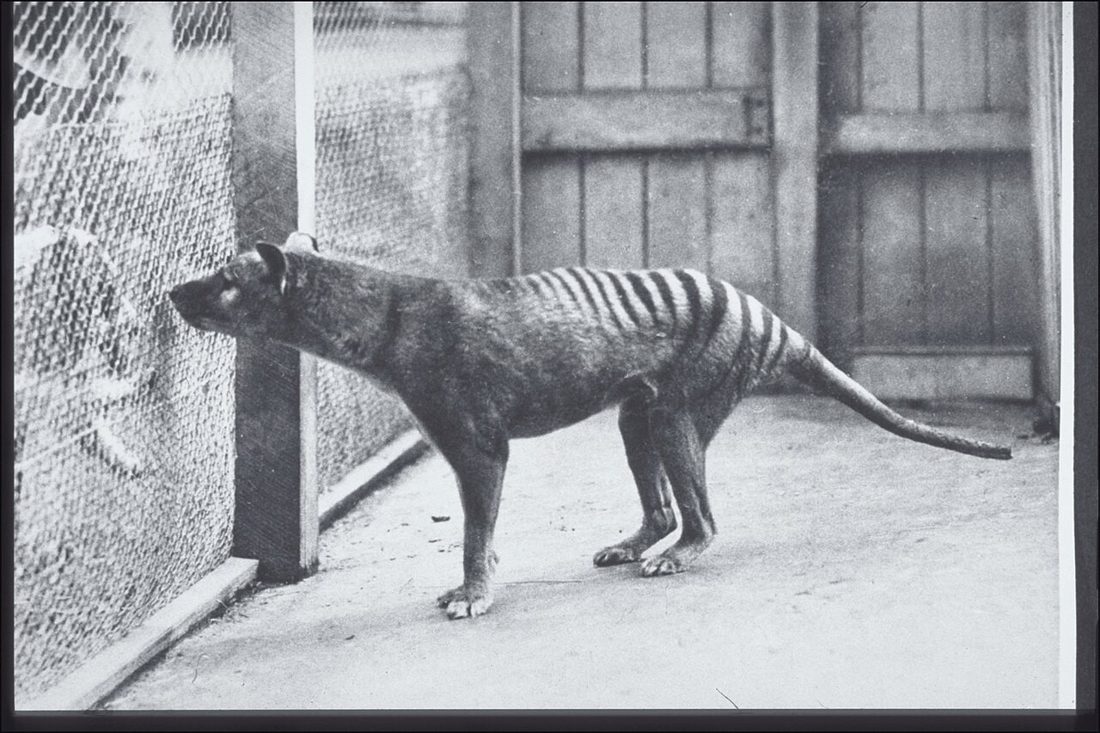
The last thylacine died in a zoo in 1936.
Is that normal? How many species should we expect to lose?
Photo: Harry Burrell, public domain
PART 2 · QUESTIONS 7 AND 8
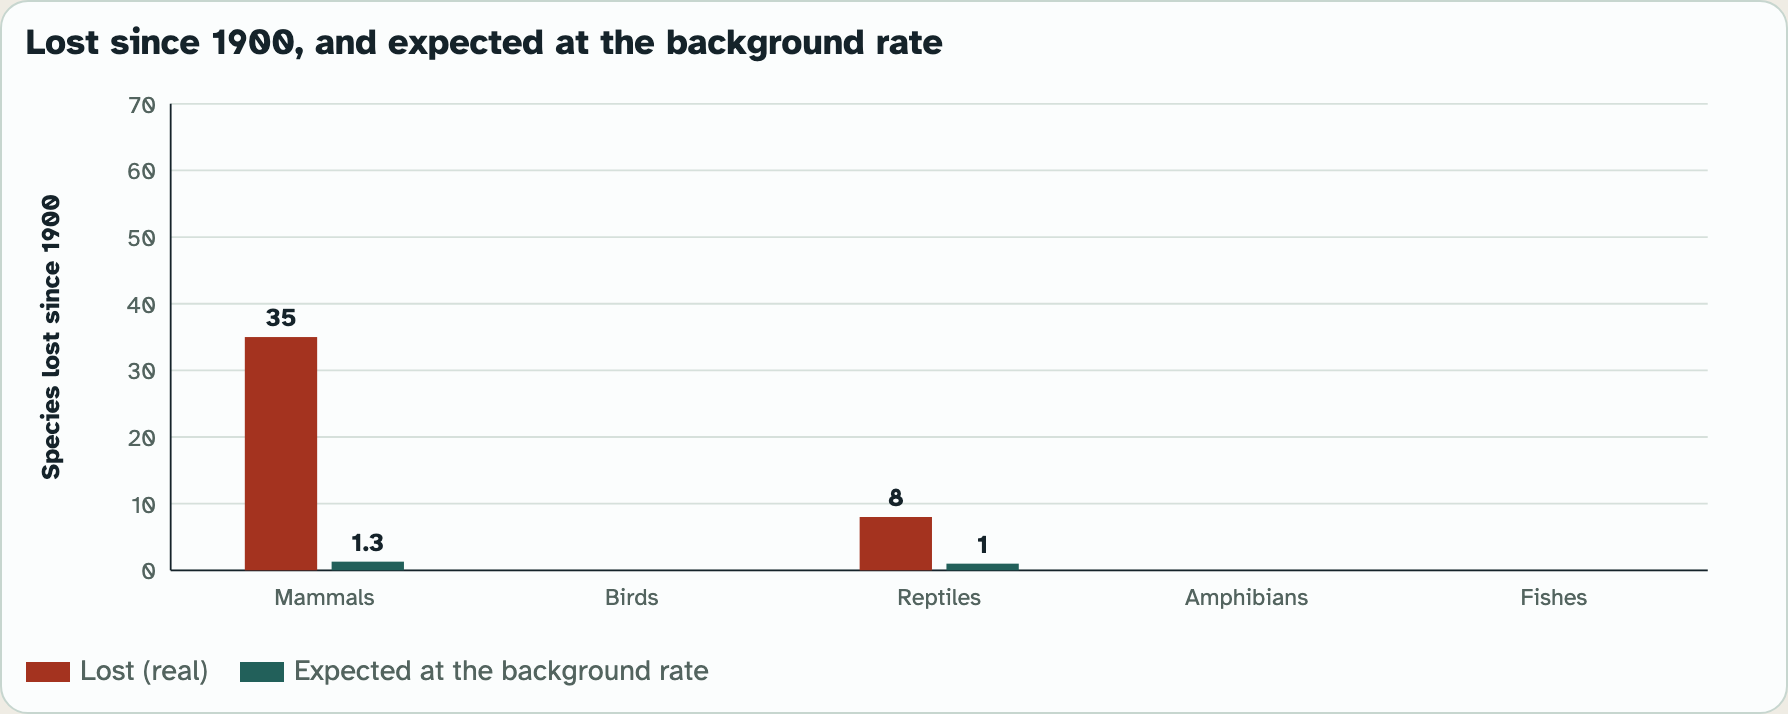
Animals lost since 1900
1
Tap each animal group.
2
Each red dot is one species gone since 1900.
3
Each green dot is one species we would expect to lose.
4
Copy the numbers into Question 7.
PART 2 · LEARN IT · 1 OF 3
The background extinction rate
Species have always gone extinct, a few at a time. That slow, natural rate is the background extinction rate.
Scientists used a generous background rate here: 2 species lost per million species per year.
At that rate, about 9 of the 39,223 animals checked should have gone extinct since 1900.
PART 2 · LEARN IT · 2 OF 3
How many times faster?
To compare, divide what happened by what was expected.
Example, mammals: 35 lost ÷ 1.3 expected = about 27 times faster than the background rate.
Now do the same for birds and for all the groups together.
Photo: Harry Burrell, public domain
PART 2 · LEARN IT · 3 OF 3
A sixth mass extinction?
The textbook says species are now going extinct at least 1,000 times the natural rate.
If that keeps up, Earth is entering a sixth mass extinction.
The first five came from natural changes. This one is driven mostly by people changing conditions, and it could happen in one human lifetime.
PART 2 · QUESTION 9
How many times faster?
1
Find the number lost since 1900.
2
Find the number expected.
3
Divide lost by expected.
Example
A town expects 2 house fires a year.
It had 30.
30 ÷ 2
= 15 times as many
These are not your numbers. Use your own.
Screenshot: mrsajdak.com/extinction, Tab 2
PART 2 · QUESTIONS 9 TO 11
Faster than normal
QUESTION 9
÷
Times faster
Birds.
All five groups.
QUESTION 10
Rate
The natural rate
Name it.
How long should the losses have taken?
QUESTION 11
Answer
A friend’s claim
"Extinction is a thing of the past."
Use one number.
TAB 3 · QUESTIONS 12 TO 16
Part 3. Who wins, who loses?
Forests are cleared for farms, roads and towns.
Does every species lose when its habitat shrinks?
Photo: Thomas Fuhrmann, CC BY-SA 4.0
PART 3 · QUESTIONS 12 AND 13
Shrink the habitat
1
Pick 40%. Press Run 30 years.
2
Watch the bars and the graph.
3
Pick 60% and run it again.
4
Copy both runs into Question 12.
PART 3 · LEARN IT · 1 OF 3
Not every species loses
When the habitat shrank, the deer and raccoons went up. They are generalists. They use farms, yards and forest edges.
The other four went down. A change in conditions can help some species and push others toward extinction.
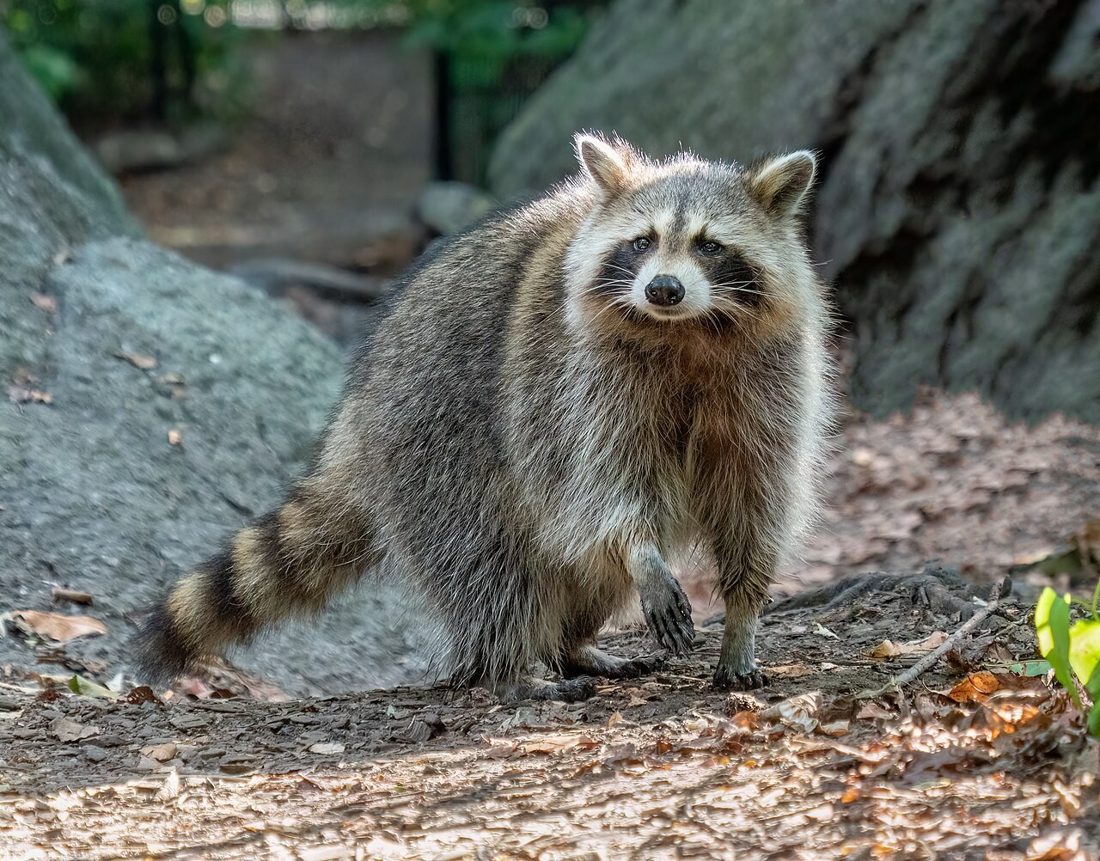
Photo: Rhododendrites, CC BY-SA 4.0
PART 3 · LEARN IT · 2 OF 3
Traits that raise the risk
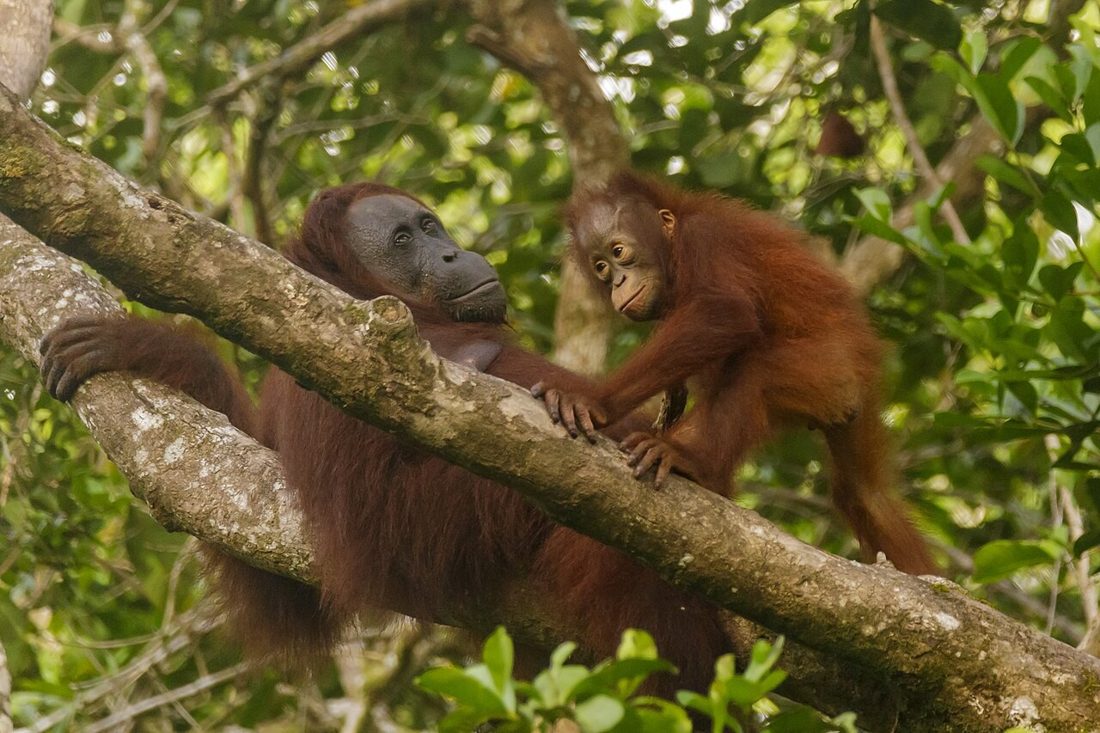
Low reproductive rate: few young. An orangutan has one baby about every 8 years.
Specialized niche: needs one thing. Karner blue caterpillars eat only wild lupine.
Requires a large territory: needs a lot of room. A Florida panther roams hundreds of square miles.
In the model, more risk traits meant a bigger drop. Large-territory species vanished once less than half their habitat was left.
Photo: Thomas Fuhrmann, CC BY-SA 4.0
PART 3 · LEARN IT · 3 OF 3
Endangered or threatened?
Scientists track each species' numbers, its range and its habitat needs. The IUCN Red List is the world list.
In this lab: down 30% to 49% = threatened. Down 50% or more = endangered.
When a species is lost, what it does is lost too. Orangutans spread the seeds of hundreds of rain forest plants.
PART 3 · QUESTIONS 14 TO 16
Traits make the difference
QUESTION 14
2 words
Threatened or endangered?
Falling, but enough for now.
So few it could soon be gone.
QUESTION 15
Traits
Name the trait
Eats only one plant.
One baby every 8 years.
QUESTION 16
Model
Simpler than real life
Name one way.
How could it change the results?
WRAP IT UP · QUESTION 17
Evaluate the evidence
Claim: "A change in environmental conditions can drive species toward extinction."
1. What changed?
2. What happened to the species?
3. Did the change come first, in the same place and time?
Then decide: the evidence supports the claim, or it does not.
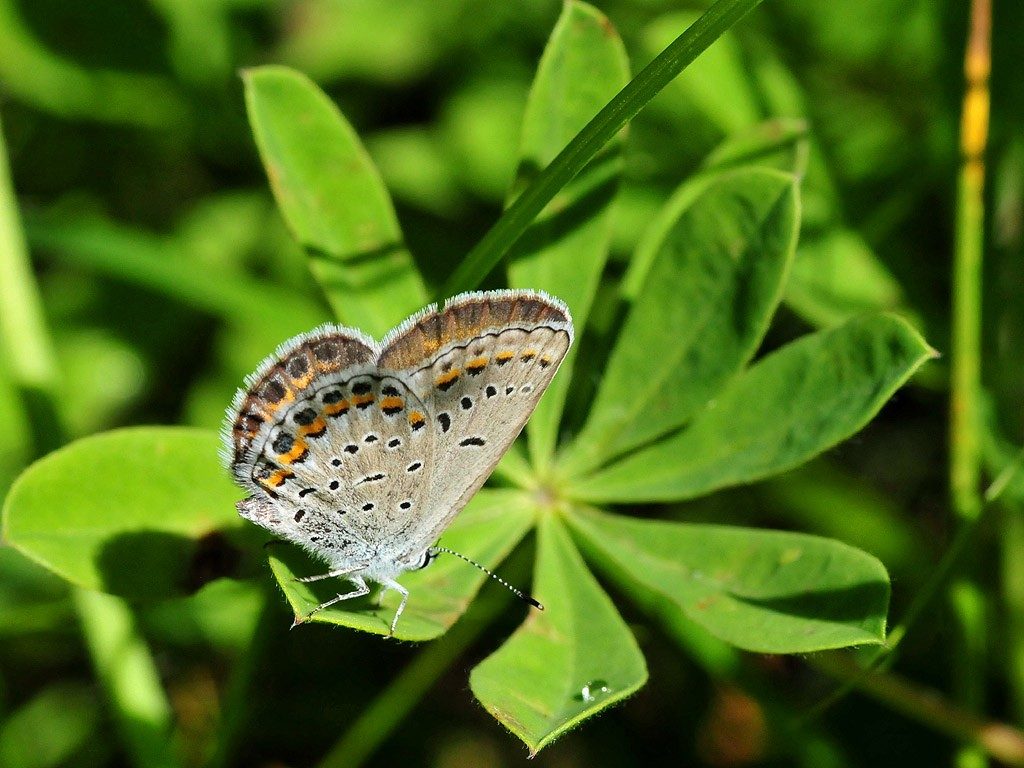
Photo: U.S. Fish and Wildlife Service, CC BY 2.0
WRAP IT UP · BACK TO THE START
Revisiting the Phenomenon
What makes a species disappear, and is it happening faster now?
EVIDENCE
The rocks
What came before every mass extinction?
EVIDENCE
The counts
How does the rate since 1900 compare with the natural rate?
EVIDENCE
The model
Which kind of species won when the habitat shrank? Which lost?
Back to the bees: which one is in more danger, the honeybee or the wild bumble bee? Use a trait to say why.
Hand in your worksheet.
Check your name, date and period.