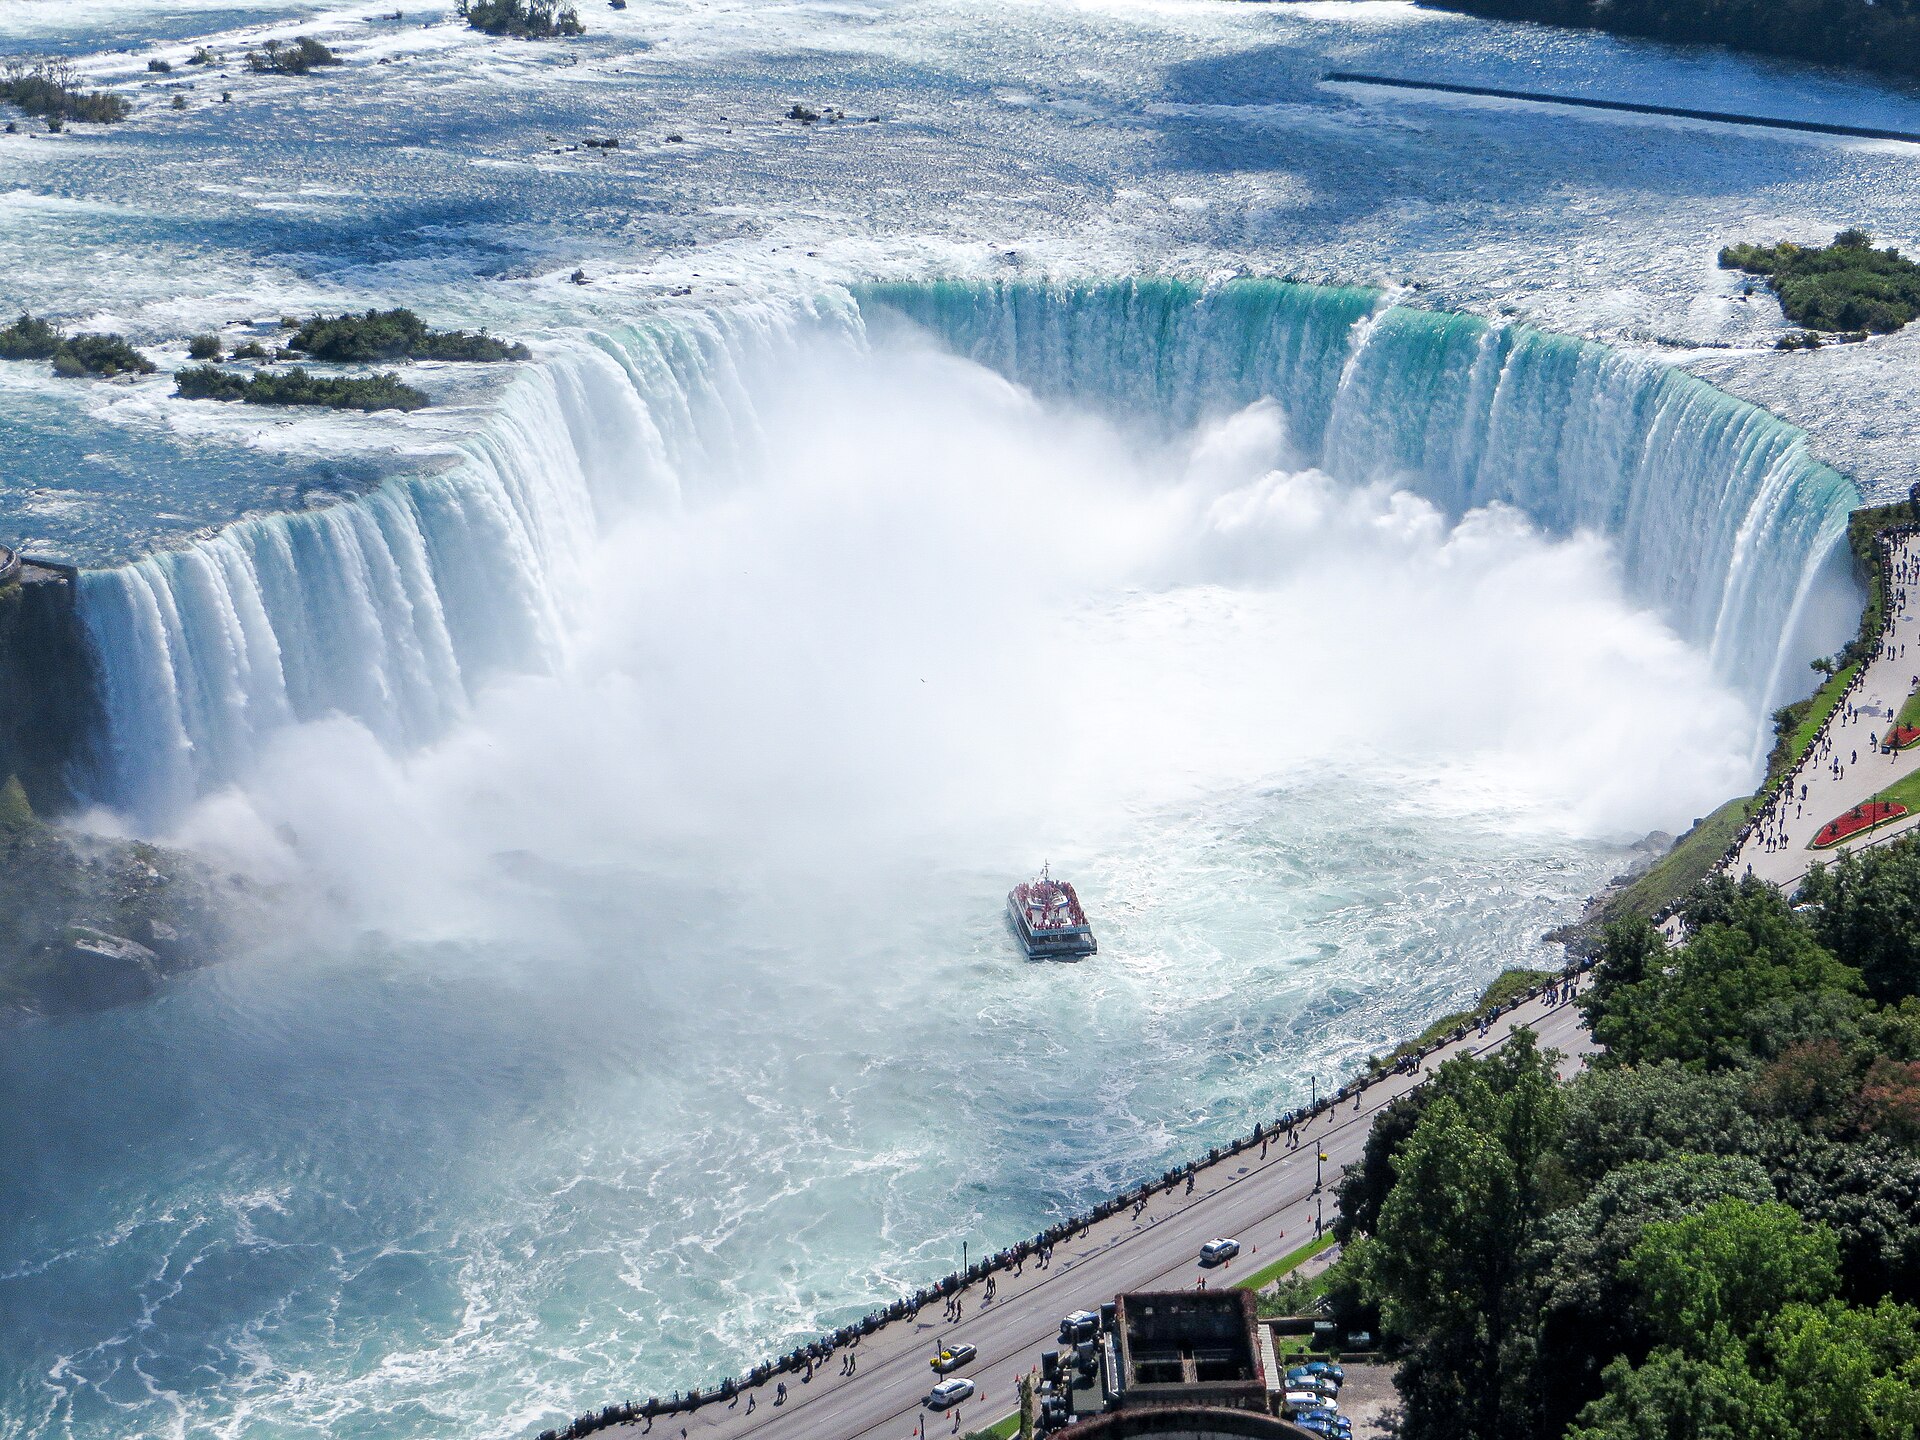
ENVIRONMENTAL SCIENCE · WATER AND ENERGY
Niagara River Current Lab
Follow along with your worksheet, one question at a time.
mrsajdak.com/niagara
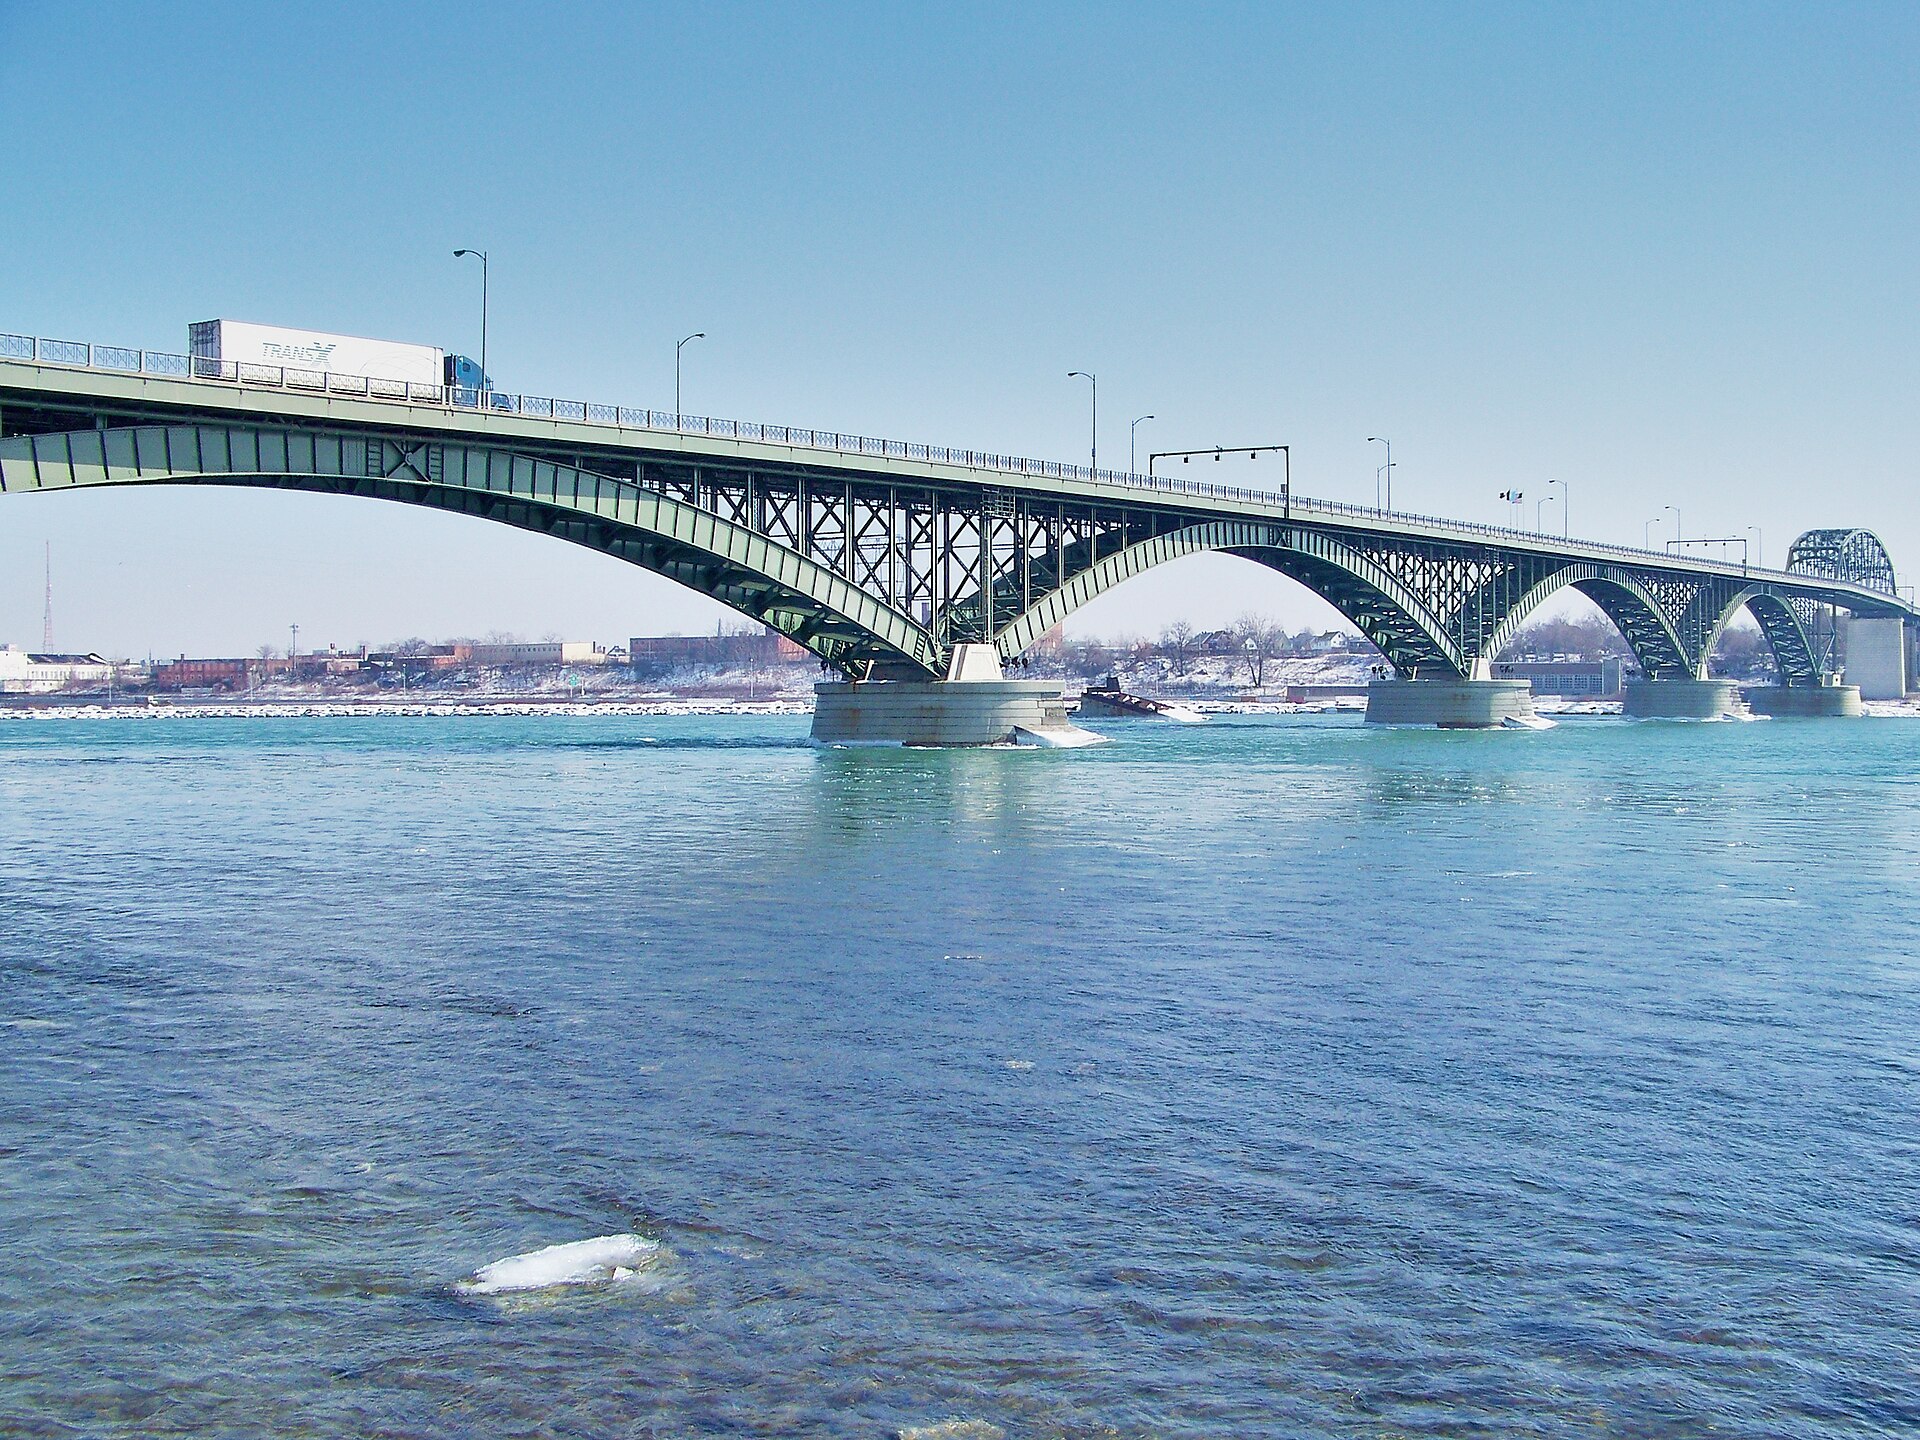
Photo: Thomaswm, CC BY-SA 4.0
START HERE
Phenomenon: One Cliff, Two Days
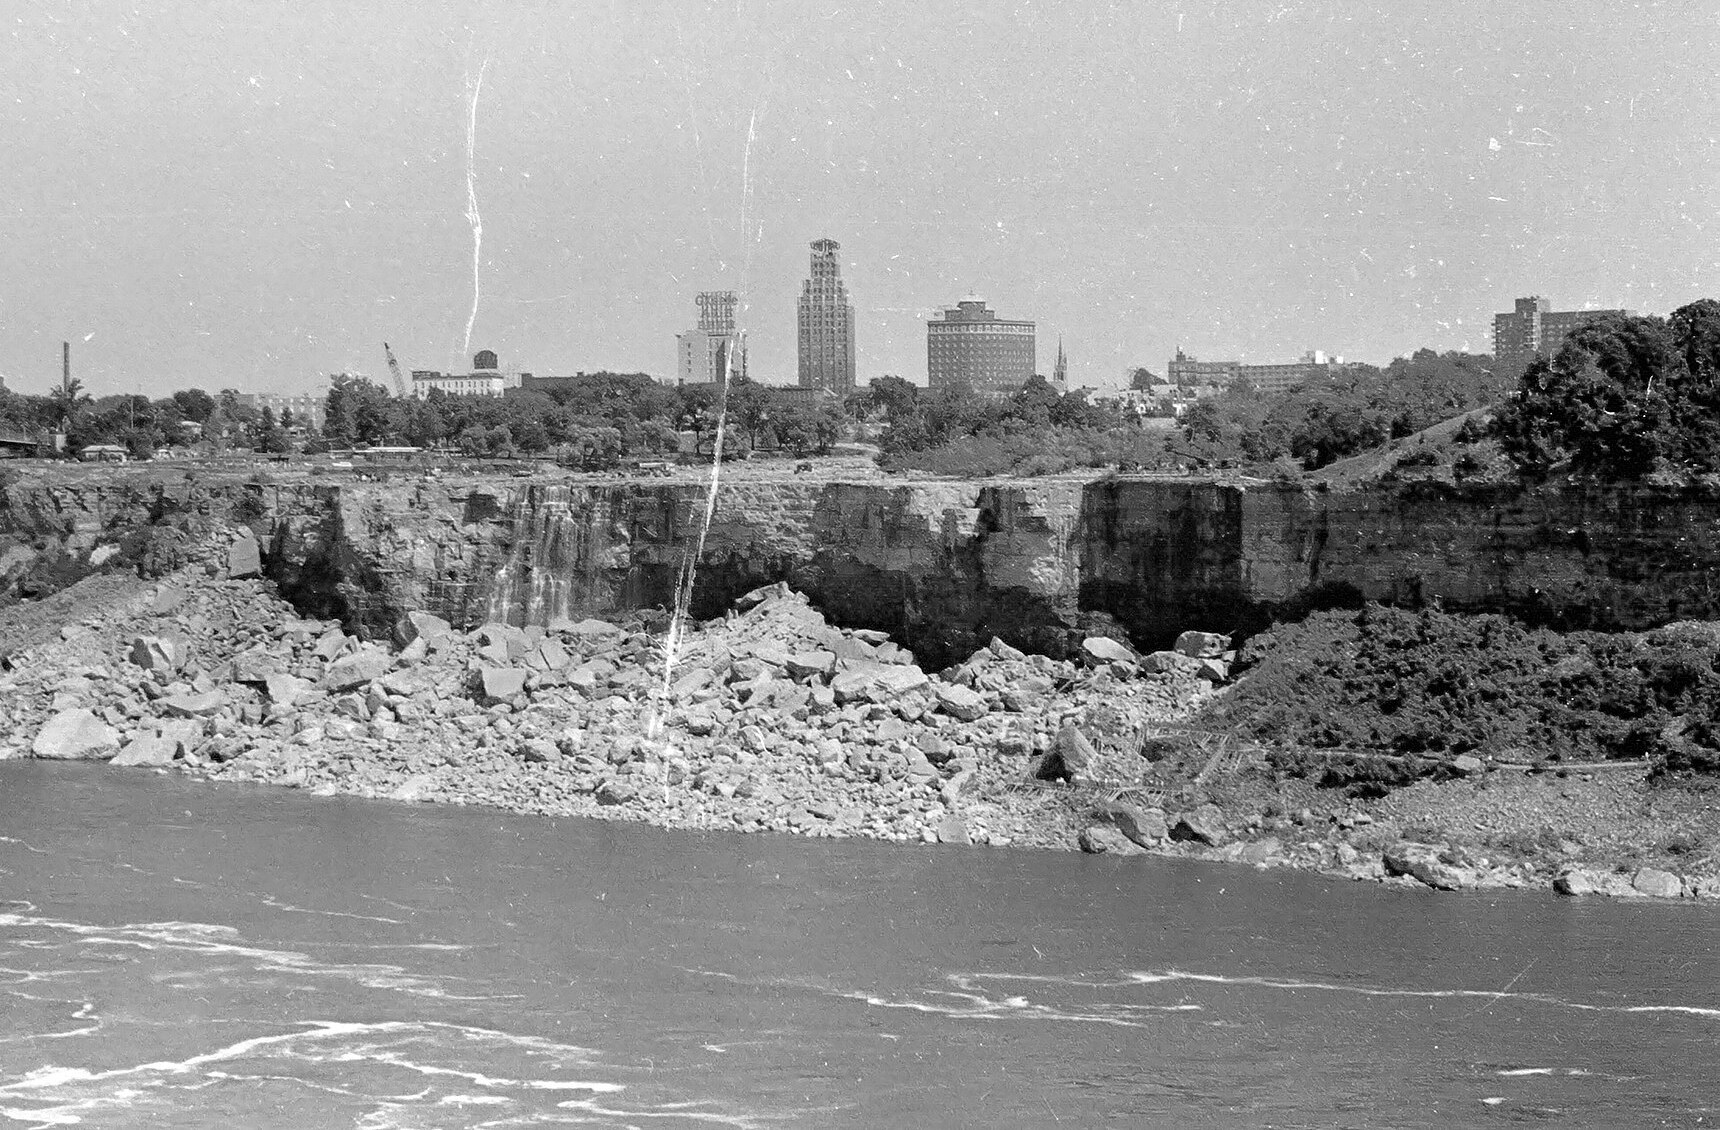
Photos: NMGiovannucci, CC BY-SA 4.0 · Ken Lund, CC BY-SA 2.0
START HERE
Observe, wonder, predict
These photographs show the same cliff from across the river. In one, a river pours over it. In the other, the rock is dry. This river drains four of the five Great Lakes. Where could that much water go?
OBSERVEWhat differences do you notice between the photographs?
WONDERWhere might the water have gone?
PREDICTCan people control how much water goes over a waterfall this big? Explain your reasoning.
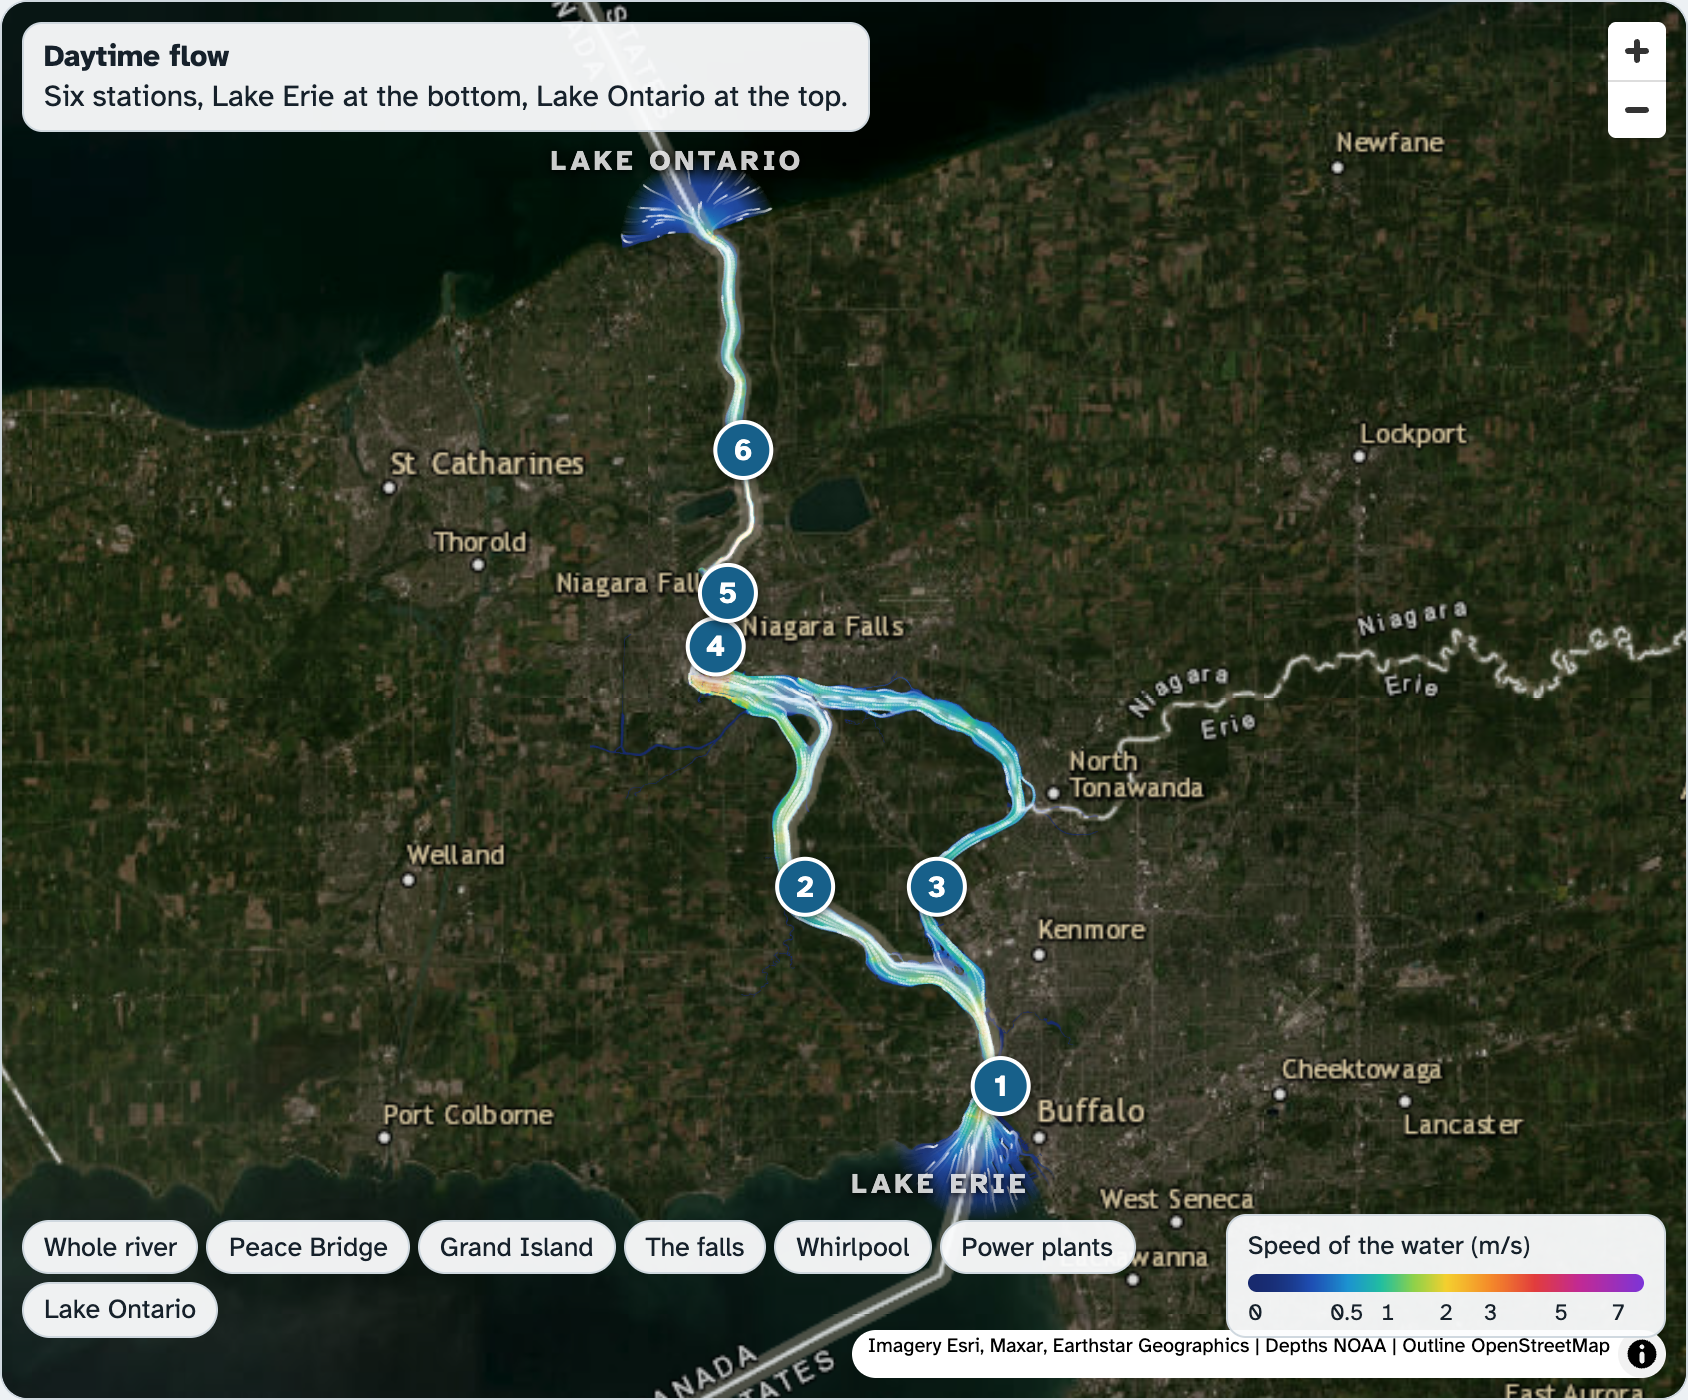
The Niagara River runs from Lake Erie (bottom) to Lake Ontario (top). The falls are near the middle.
Map: mrsajdak.com/niagara
DRIVING QUESTION
Who decides how much water goes over Niagara Falls, and where does the rest of the river go?
START HERE
What Happened Here?
Finished observing? Click here to find out.
In June 1969, the U.S. Army Corps of Engineers built a temporary dam of rock and earth across the river above the American Falls. For about five months the water went around the other side of Goat Island, and the American Falls stood dry. Engineers walked on the riverbed and studied the rock. In November 1969 they took the dam out, and the water came back.
Today, you will investigate the whole Niagara River, not just the falls. You will measure it at six places, find out where its water goes, and ride it from one Great Lake to the next. At the end of the investigation, you will return to the driving question.
BEFORE YOU START
Five things you can measure
Width
How far it is across the river, bank to bank. In meters (m).
Depth
How far down to the riverbed. The lab gives the average.
Speed
How fast the water moves, in meters per second (m/s).
Area
The size of the cut across the river. Area = width × depth, in m².
Flow
How much water passes each second. Flow = area × speed, in m³/s.
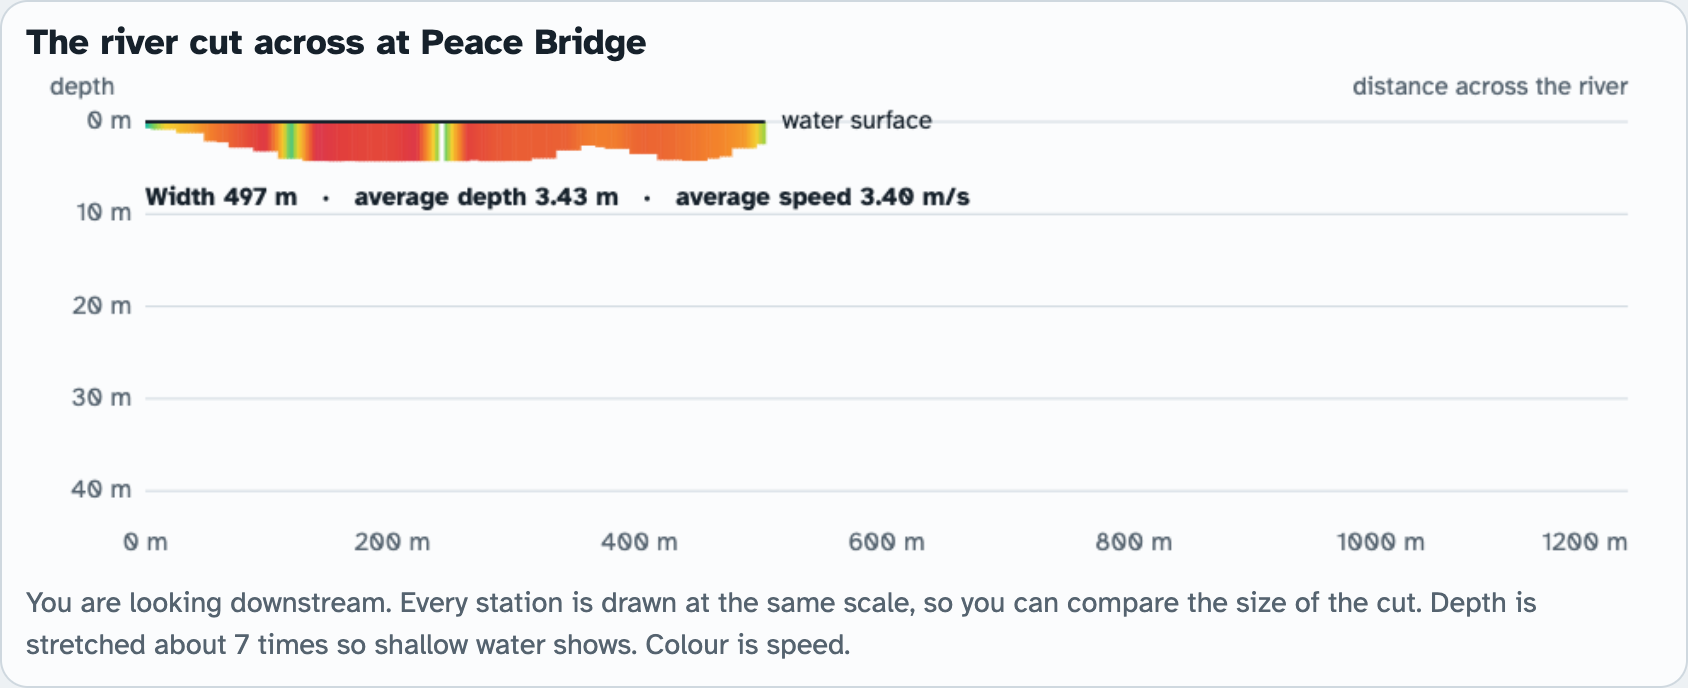
The river cut open at one station. You are looking downstream. The coloured shape is the area.
1 m³ of water is 1,000 liters. It weighs as much as a small car.
BEFORE YOU START
What you will learn
I can use width, depth and speed to explain why a river runs fast in some places and slow in others.
I can use flow numbers to weigh the costs and benefits of sending river water through power plants.
BEFORE YOU START
Get set up
1
Open mrsajdak.com/niagara on your device.
2
Write your name, the date and your period on the worksheet.
3
Get a calculator. Your phone or your device has one.
4
Find the three tabs at the top of the lab. Each tab goes with one part of the worksheet.
5
Start on Tab 1. Do not skip ahead.

| Tab in the lab | Worksheet | Questions |
|---|---|---|
| 1. Measure the river | Part 1 | 1 to 6 |
| 2. Share the water | Part 2 | 7 to 11 |
| 3. Ride the river | Part 3 and Wrap it up | 12 to 16 |
Screenshot: mrsajdak.com/niagara
TAB 1 · QUESTIONS 1 TO 6
Part 1. Measure the river
The river is not the same shape everywhere. It is wide here, narrow there, shallow here, deep there.
You will measure it at six stations. Watch what the shape does to the speed.
Photo: Óðinn, CC BY-SA 3.0
PART 1 · TAB 1
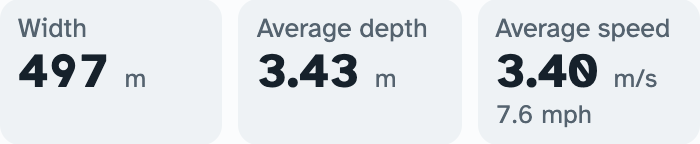
Pick a station
1
Find Pick a station. Press 1. Peace Bridge.
2
The map flies there. The yellow line is your station. It goes bank to bank.
3
Read the three numbers under Station 1: width, average depth, average speed.
4
Colour shows speed. Blue is slow. Red and purple are fast.
5
You can also tap the water anywhere to read that one spot.
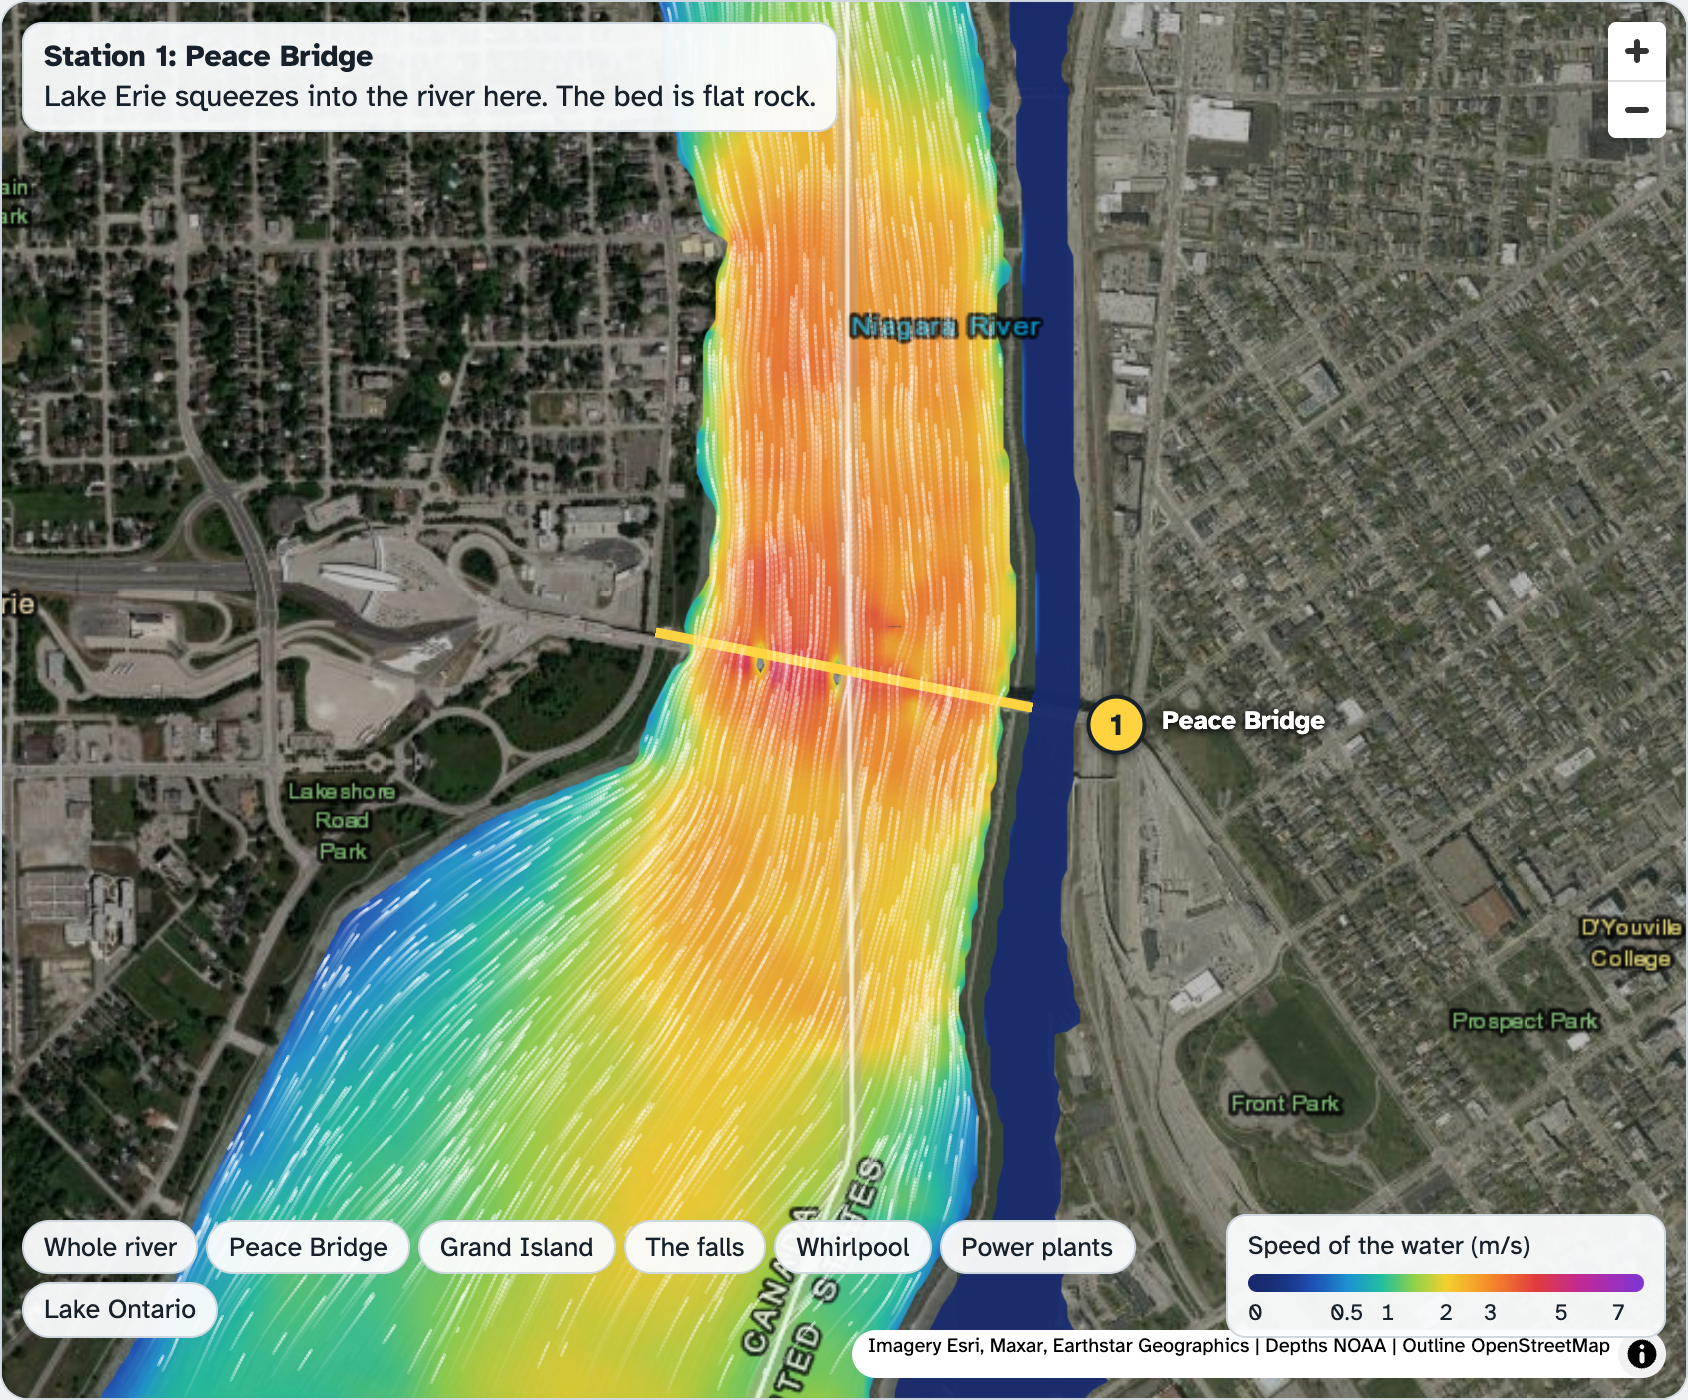
Lake Erie is at the bottom of the map. The water runs north, up the screen.
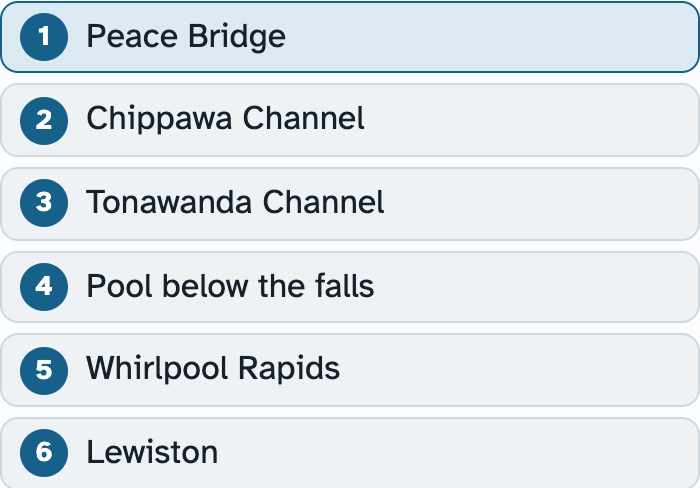
Screenshots: mrsajdak.com/niagara, Tab 1
PART 1 · QUESTION 1
Three numbers in, two numbers out
1
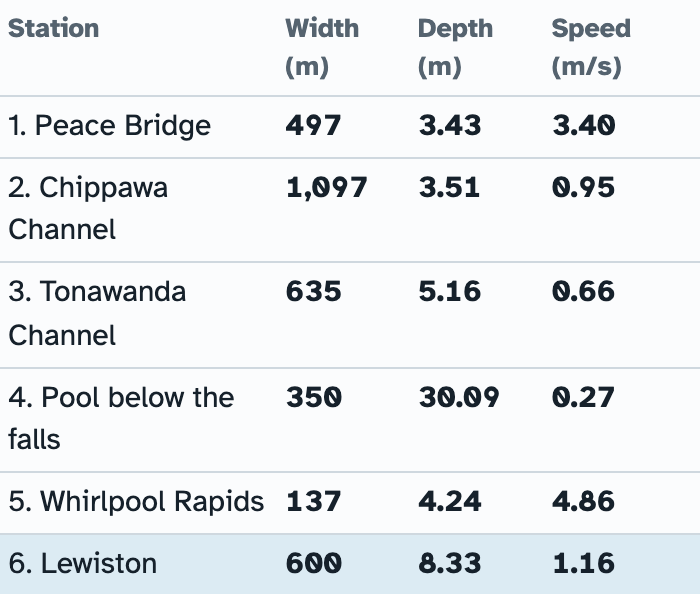
Copy the width, average depth and average speed for the station.
2
Multiply width × depth. That is the area.
3
Multiply area × speed. That is the flow.
4
Round area and flow to the nearest whole number.
5
Do all six stations.
Example
Width 200 m. Depth 5 m. Speed 2 m/s.
1,000 × 2 = 2,000 m³/s
Area = 200 × 5 = 1,000 m².
These are not your numbers. Use your own.
Screenshots: mrsajdak.com/niagara, Tab 1
PART 1 · QUESTIONS 2 AND 3
Look at the size of the cut
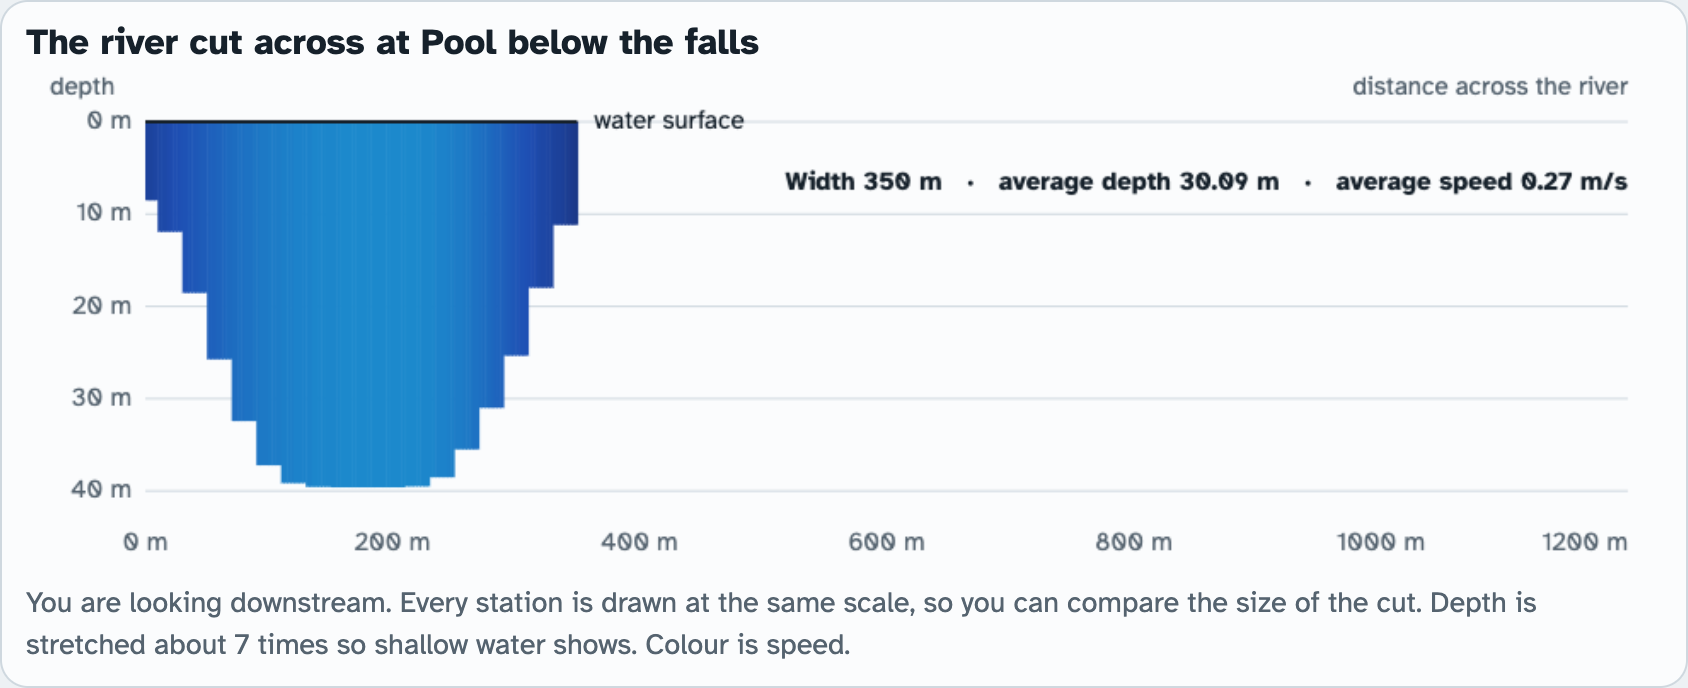
Station 4, the pool below the falls.
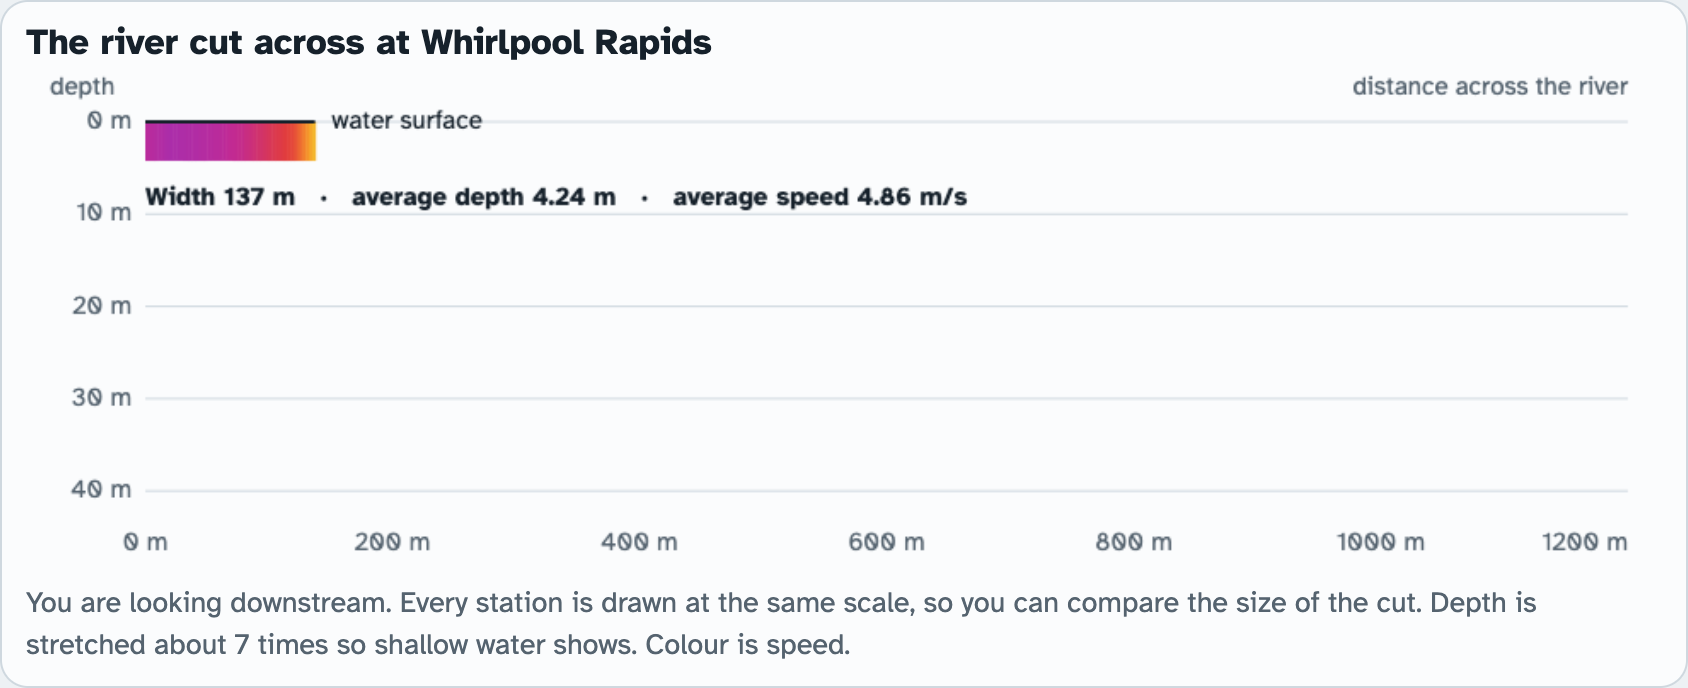
Station 5, the Whirlpool Rapids. Same scale.
QUESTION 2
Fastest and slowest
Look down your speed column. Write the station and its speed.
QUESTION 3
Area and speed
Find the area of your fastest station and your slowest station.
What happens to the speed when the cut gets smaller?
Screenshots: mrsajdak.com/niagara, Tab 1
PART 1 · LEARN IT · 1 OF 4
Water is not used up
Matter is not made or destroyed: conservation of matter. If two lines pass the same flow, no water was lost between them.
Screenshot: mrsajdak.com/niagara, Tab 1
PART 1 · LEARN IT · 2 OF 4
Area and speed trade off
Flow = area × speed. The same flow through a smaller area means faster water. A bigger area means slower water.
Screenshot: mrsajdak.com/niagara, Tab 1
PART 1 · LEARN IT · 3 OF 4
Think of a crowd
The same number of people must leave a stadium each minute. In a wide hall they stroll. At a narrow gate they hurry.
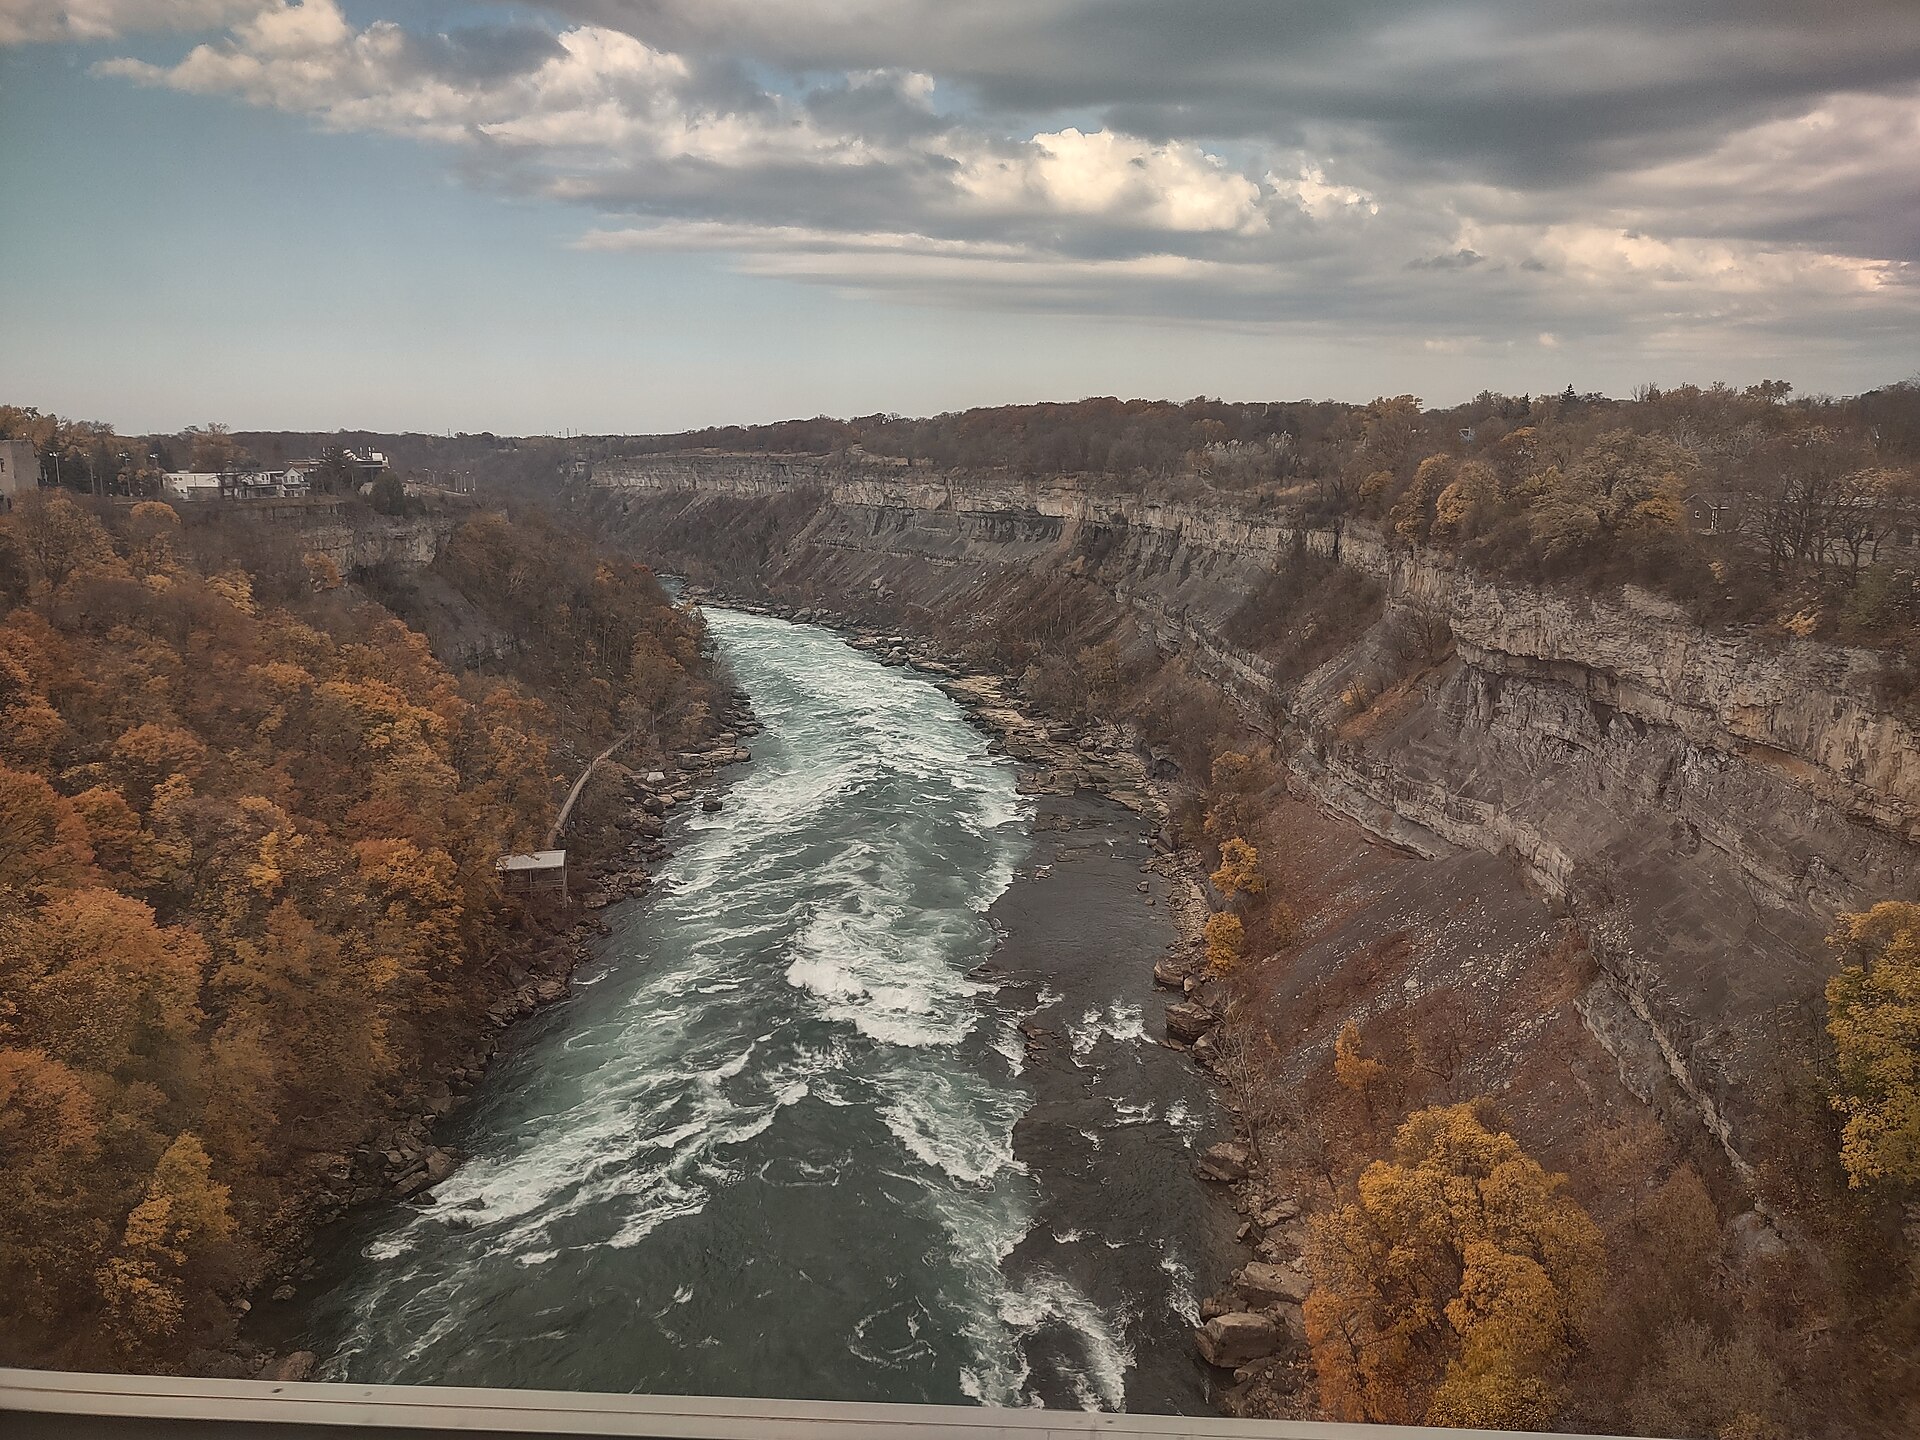
Photo: Jim.henderson, CC BY-SA 4.0
PART 1 · LEARN IT · 4 OF 4
Width is not everything
Area is width × depth. A wide but shallow river can have a small area. A narrow but deep one can have a huge area.
Screenshot: mrsajdak.com/niagara, Tab 1
PART 1 · QUESTIONS 4 TO 6
Follow the water
QUESTION 4
2 + 3
Around the island
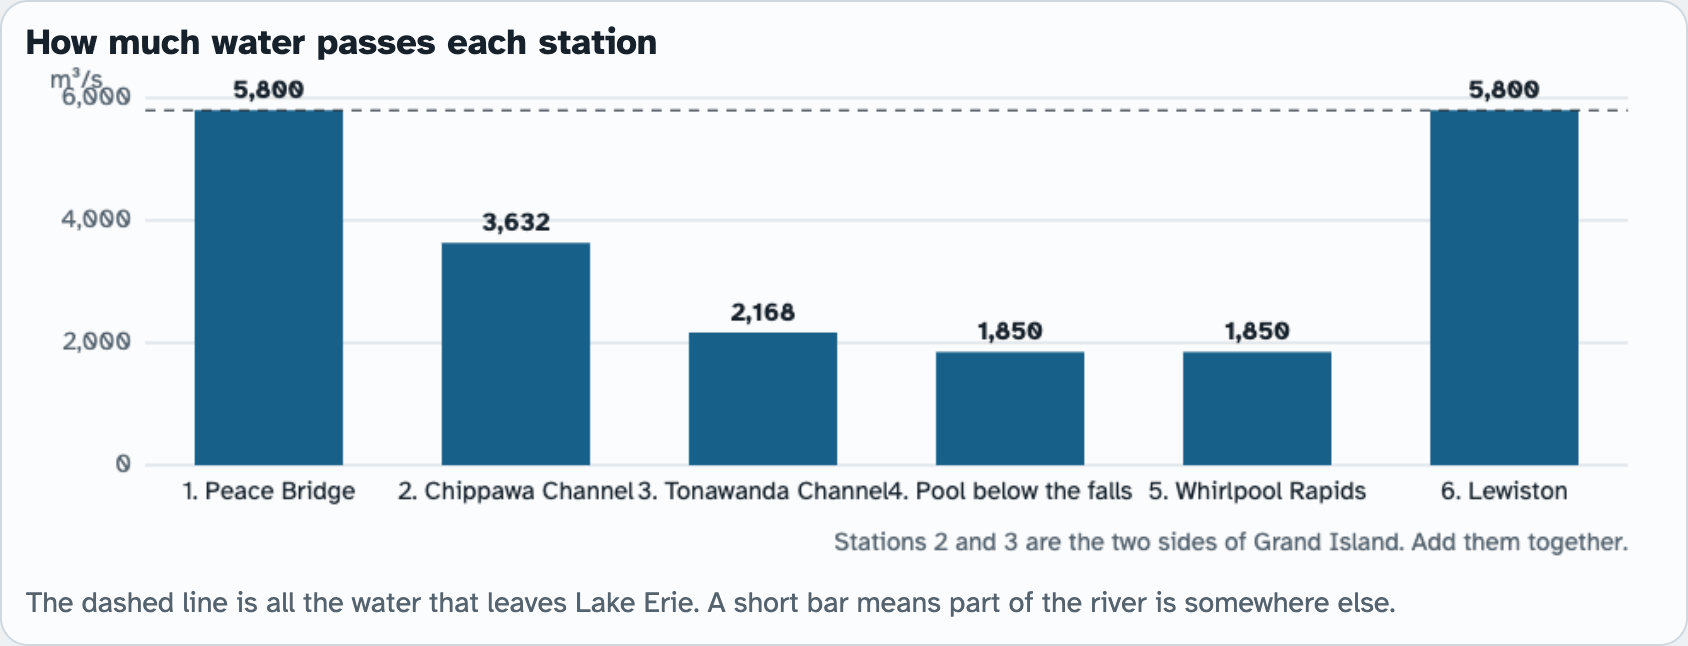
Stations 2 and 3 are the two sides of Grand Island. Add their flows and compare with Station 1.
Use conservation of matter to explain.
QUESTION 5
4 → 5
Crawl, then race
The same water passes Station 4, then Station 5.
Use flow = area × speed and their areas to explain the change in speed.
QUESTION 6
?
Something is missing
Compare the flow at Stations 1 and 6 with Stations 4 and 5.
How much is missing? Predict where it went.
TAB 2 · QUESTIONS 7 TO 11
Part 2. Share the water
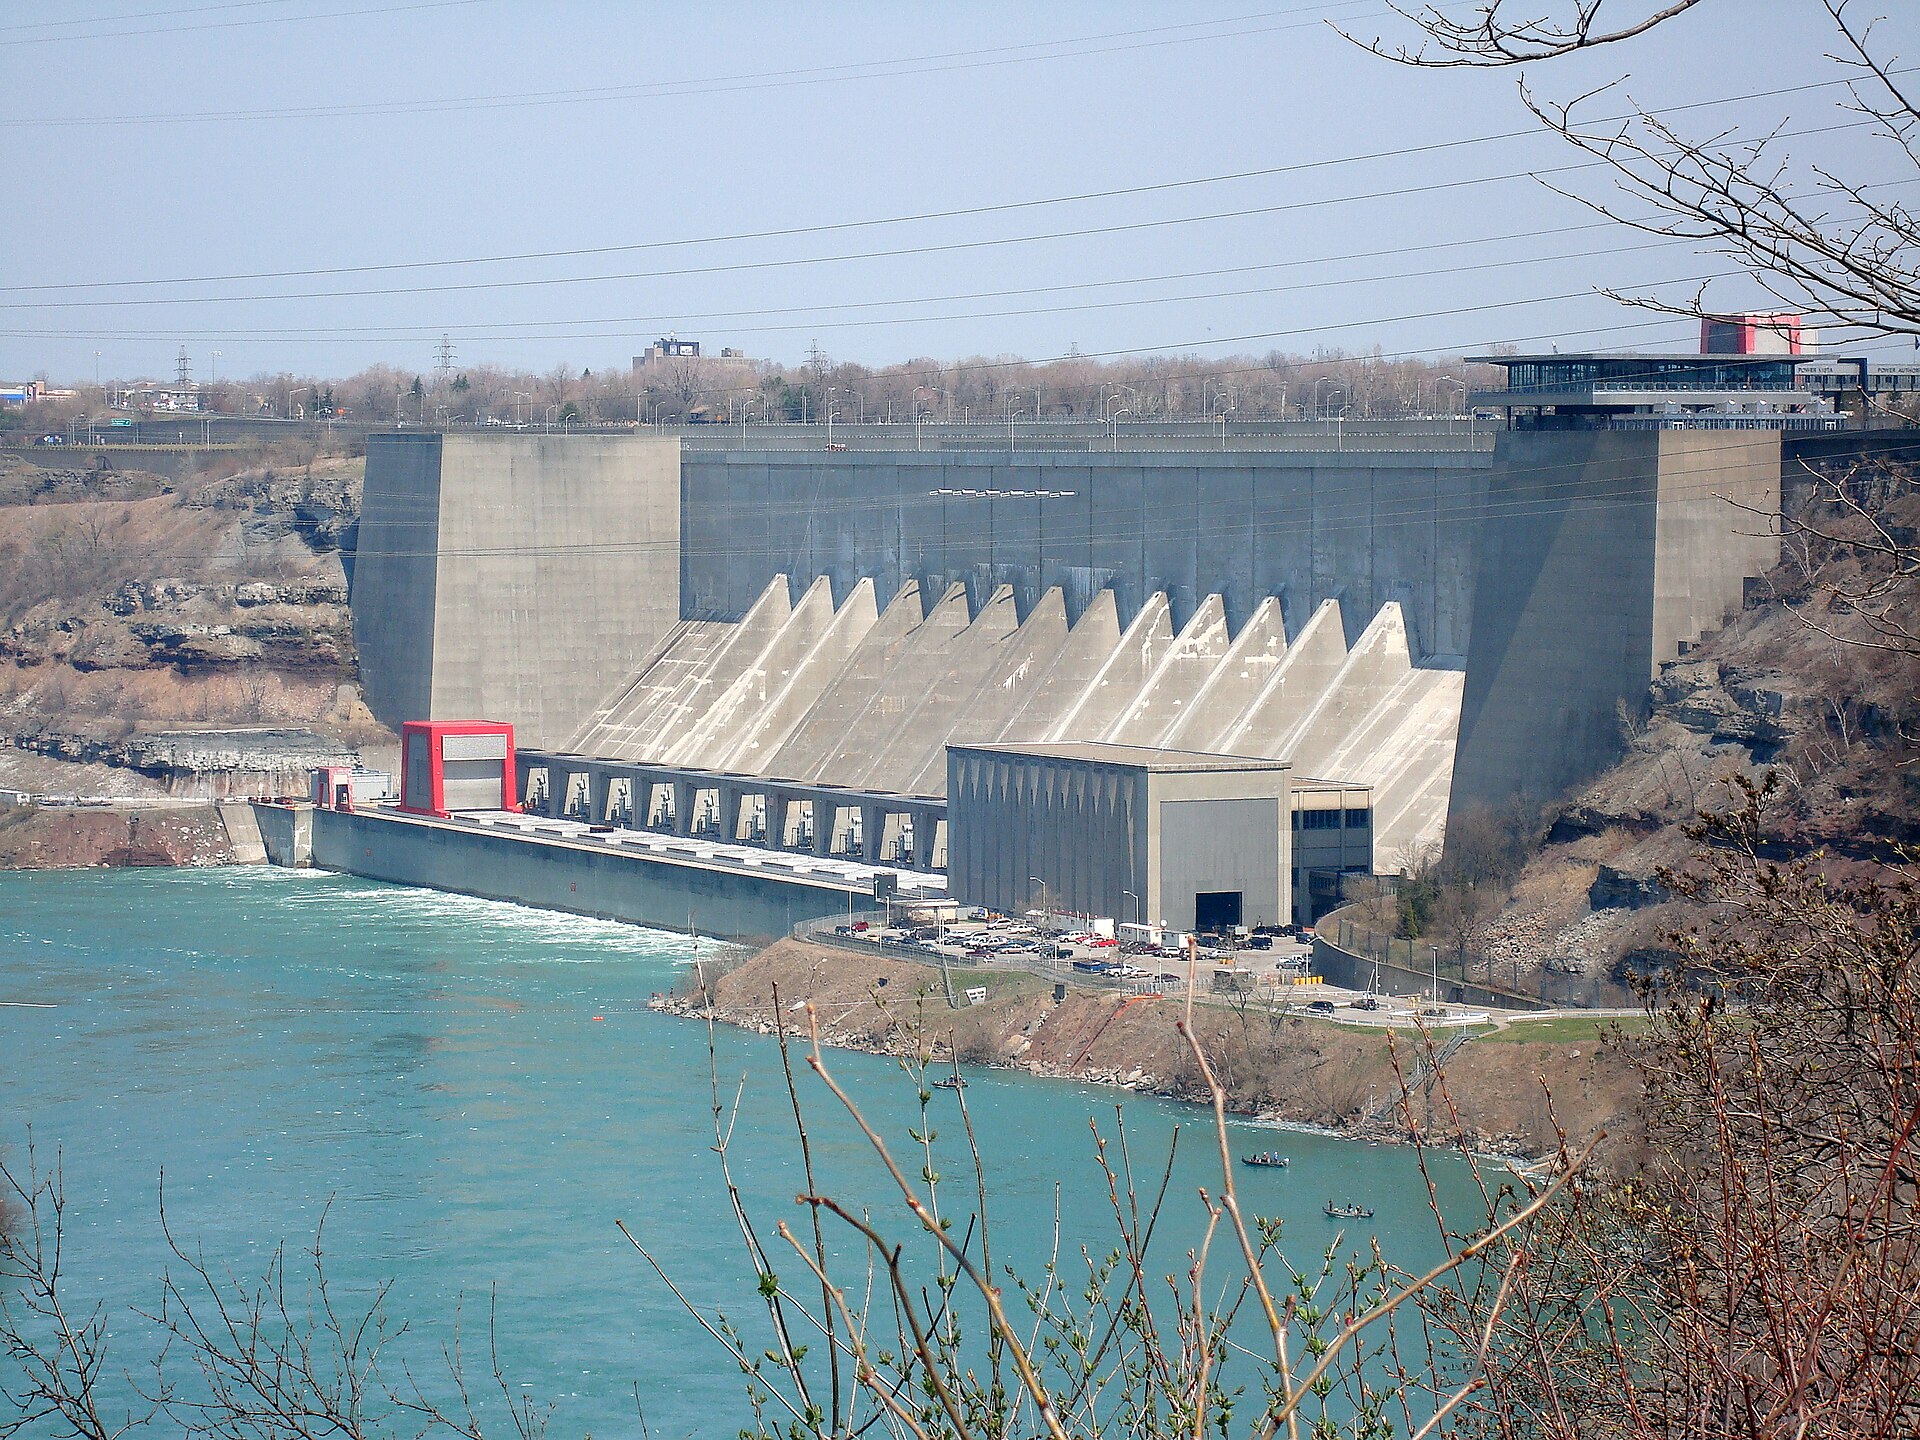
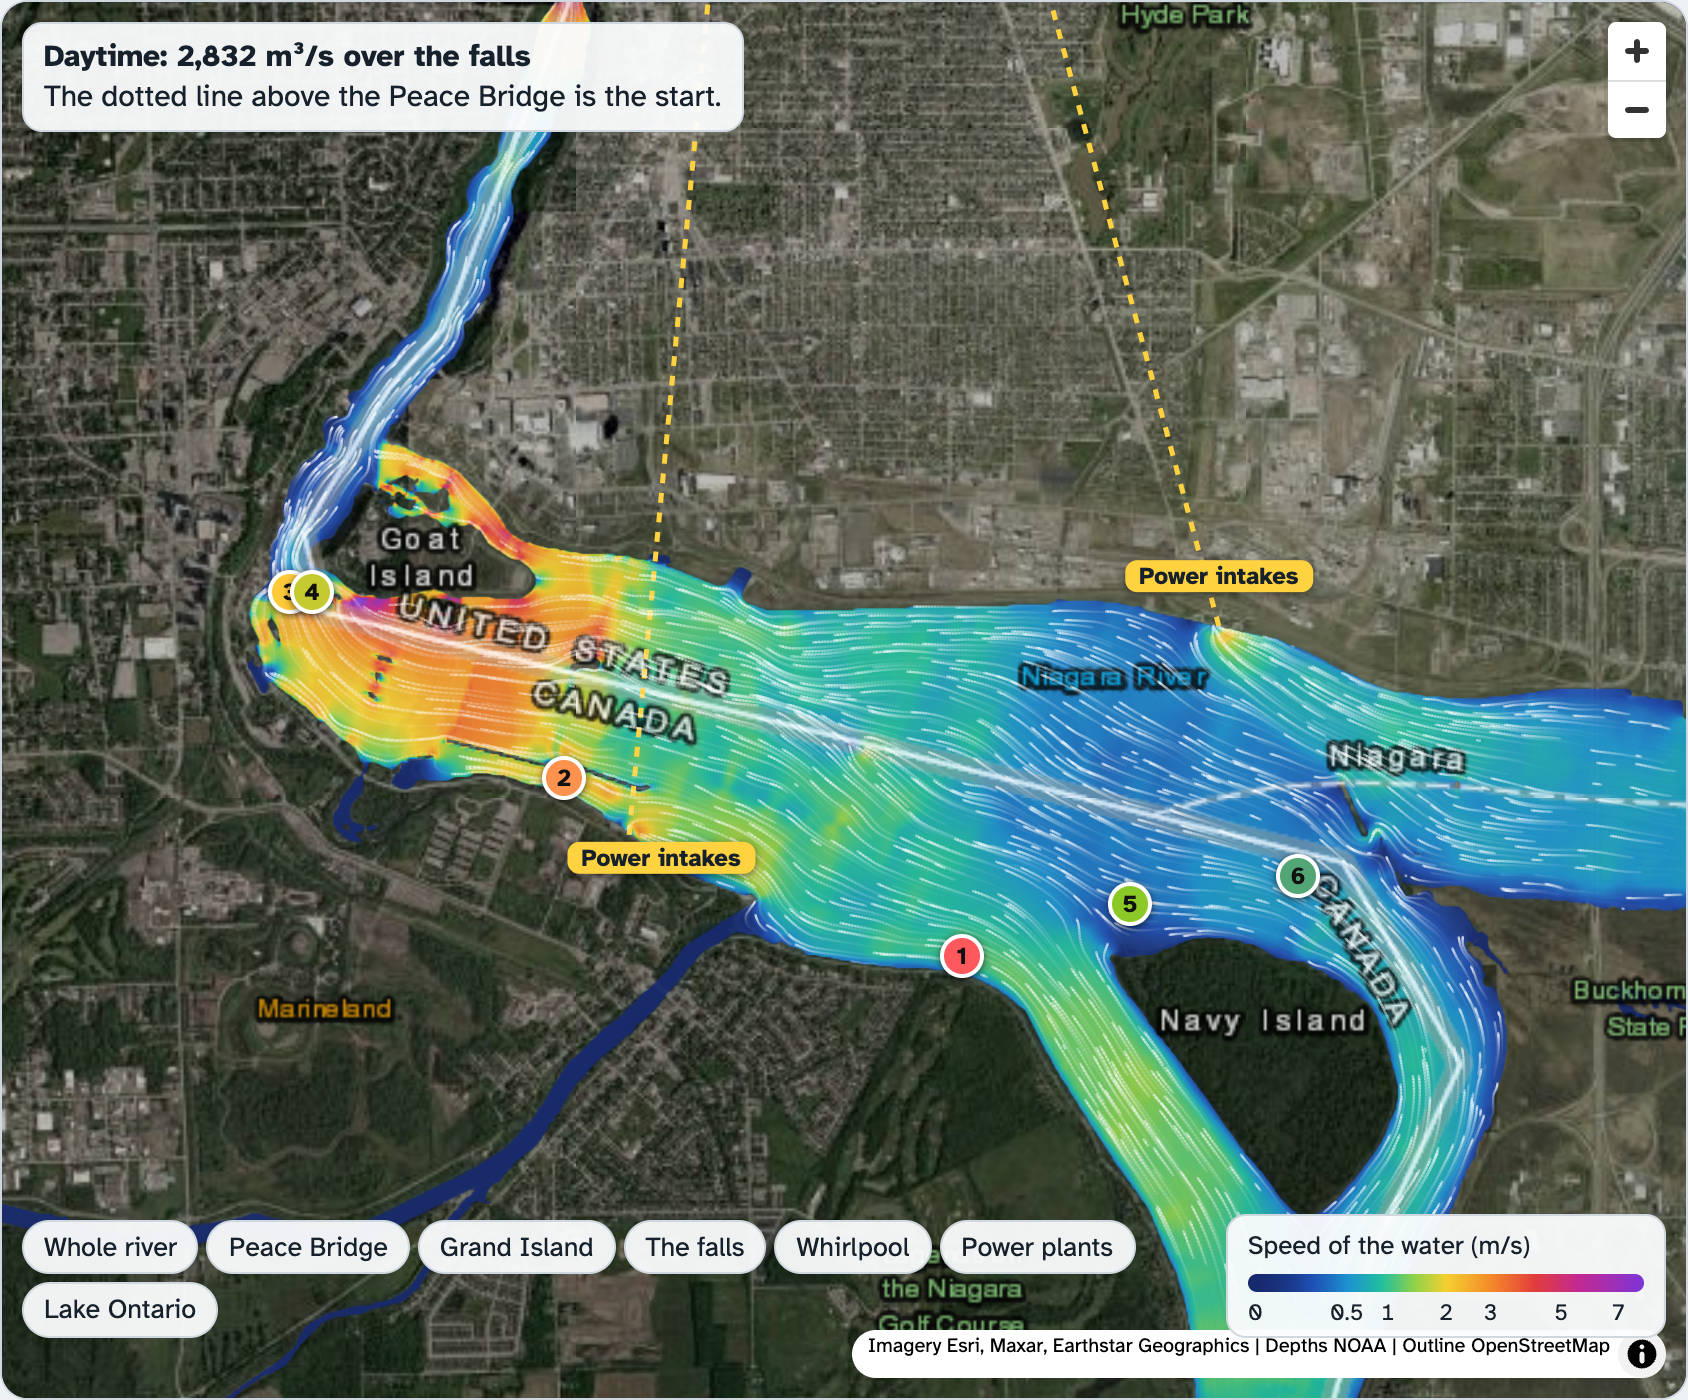
Above the falls, tunnels and a canal take water out of the river.
It comes back here, at the power plants, 7 km downstream.
Photo: Busfahrer, CC BY 3.0
PART 2 · TAB 2
Two countries, one river
DAYTIME
2,832
m³/s over the falls
In 1950 the United States and Canada signed a treaty. By day in tourist season, the falls must get at least this much.
OVERNIGHT
1,850
m³/s over the falls
At night and in winter the treaty lets the plants take more. This is what the gauge usually reads at night.
THE REST
0.8 MW
for each m³/s
The rest goes through the power plants. Each cubic meter per second makes about 0.8 megawatts.
PART 2 · QUESTION 7
Daytime, then overnight
1
Press Daytime.
2
Copy three numbers from Where the water goes: over the falls, through the plants, electric power.
3
Find Station 5 in The stations at this setting. Copy its depth and speed.
4
Work out the percent through the plants.
5
Press Overnight. Do it all again.
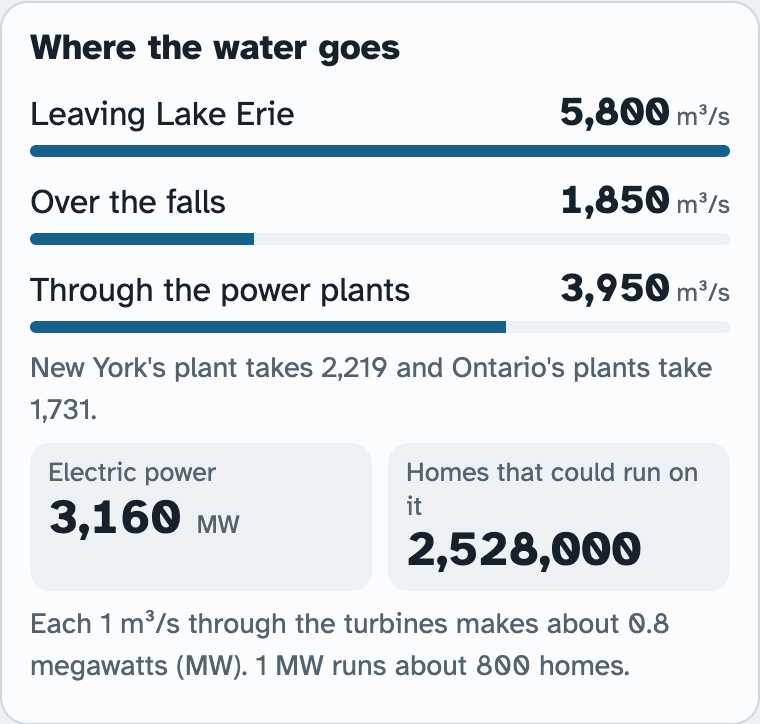
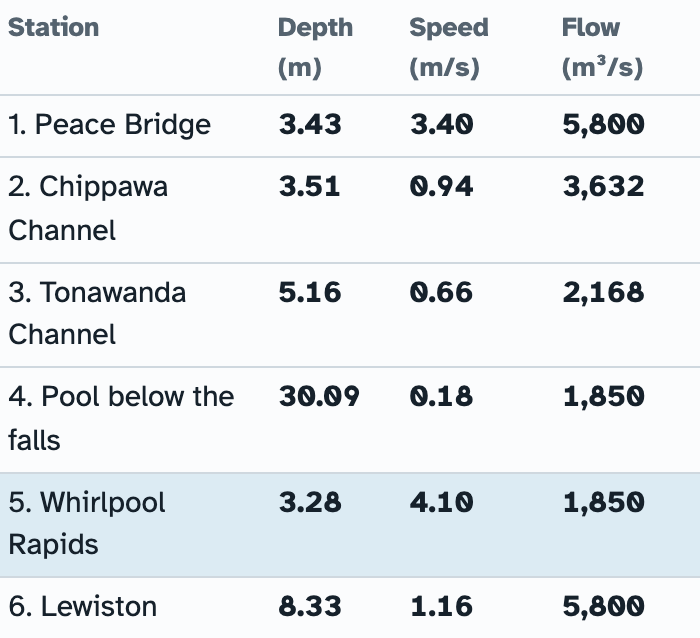
Example
2,900 ÷ 5,800 × 100 = 50%
2,900 through the plants.
These are not your numbers. Use your own.
Screenshots: mrsajdak.com/niagara, Tab 2
PART 2 · LEARN IT · 1 OF 4
Water takes a shortcut
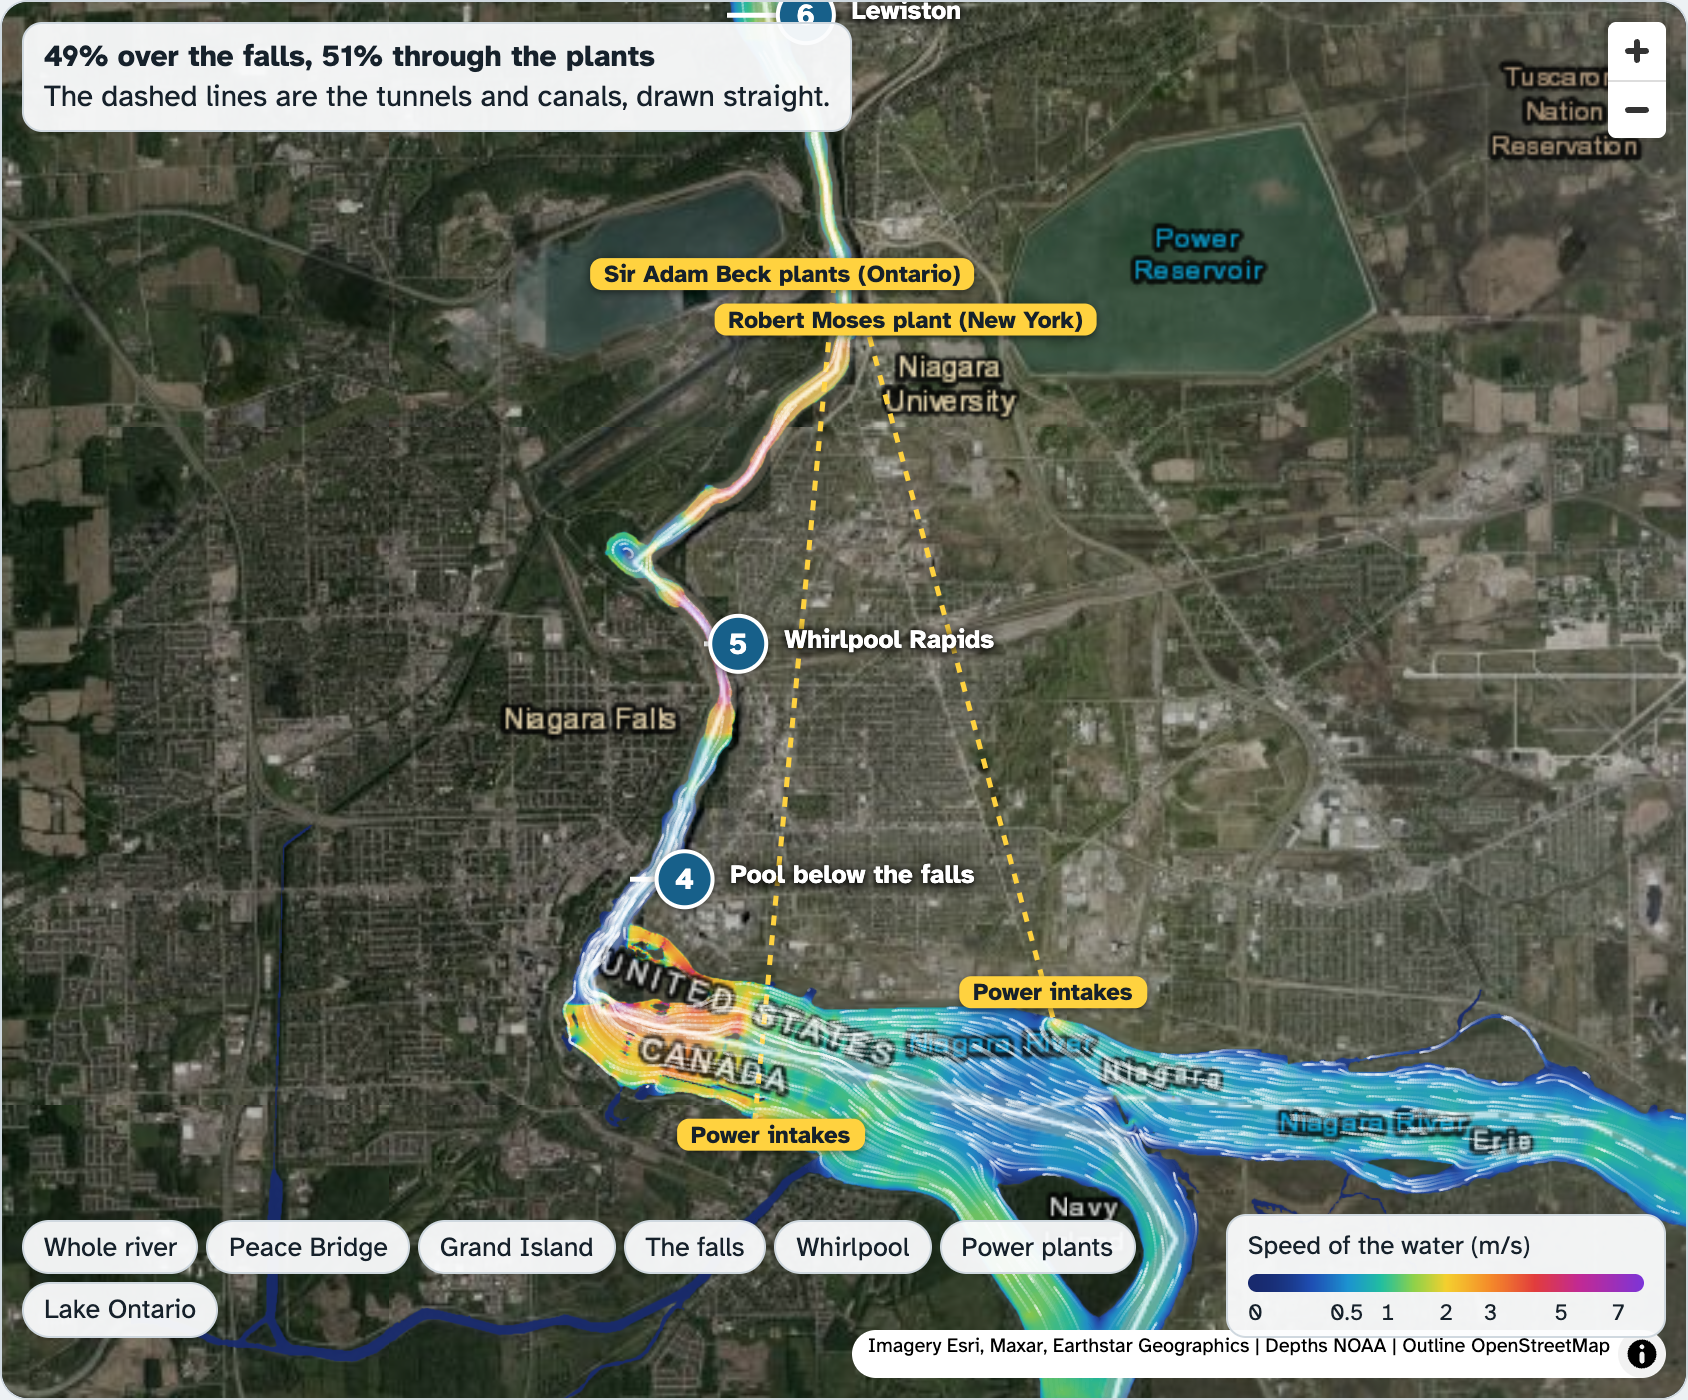
Above the falls, intakes pull water out. Tunnels carry it around the falls to the power plants. It rejoins the river just above Lewiston.
Screenshot: mrsajdak.com/niagara, Tab 2
PART 2 · LEARN IT · 2 OF 4
Energy changes form
High water has potential energy. Falling 90 m, it gains kinetic energy. It spins a turbine, and a generator makes electrical energy.
Photo: Busfahrer, CC BY 3.0
PART 2 · LEARN IT · 3 OF 4
More water, more power
1 m³/s falling 90 m gives about 0.9 MW. The plants turn about 9 parts in 10 into electricity: about 0.8 MW. Twice the water, twice the power.
Screenshot: mrsajdak.com/niagara, Tab 2
PART 2 · LEARN IT · 4 OF 4
Costs and benefits
A 1950 treaty keeps 2,832 m³/s on the falls by day. Water power burns no fuel. But water sent to the plants skips the falls and the gorge.
Photo: Thomaswm, CC BY-SA 4.0
PART 2 · QUESTIONS 8 AND 9
Where it leaves, where it comes back
Dashed lines: the tunnels and canals, drawn straight.
QUESTION 8
Why do only two stations change?
Find the power intakes and the power plants on the map. Which stations are in between?
QUESTION 9
A shallower gorge
Subtract the overnight depth at the rapids from the daytime depth. Who would notice?
Screenshots: mrsajdak.com/niagara, Tab 2
PART 2 · QUESTIONS 10 AND 11
Your turn at the controls
1
Drag the Water over the falls slider all the way to the right. Nothing goes to the plants.
2
Copy the power, the homes and the speed at Station 5.
3
Drag it all the way to the left. The plants take all they can.
4
Copy the same numbers.
5
Question 11: check the daytime power with a calculator.
QUESTION 11
Check the power, then follow the energy
Multiply the daytime flow through the plants by 0.8. Do you get the lab's MW?
Use potential energy, kinetic energy and electrical energy to tell what happens to the water's energy.
TAB 3 · QUESTIONS 12 TO 15
Part 3. Ride the river
Ten floats start in a row across the river.
Each one goes where its water goes. Not all of them get to Lake Ontario.
Photo: Jim.henderson, CC BY-SA 4.0
PART 3 · QUESTION 12
Release the floats
1
Pick Daytime. Press Release 10 floats.
2
Watch for a while. Zoom in on the falls to see where they split up.
3
Press Skip to the end.
4
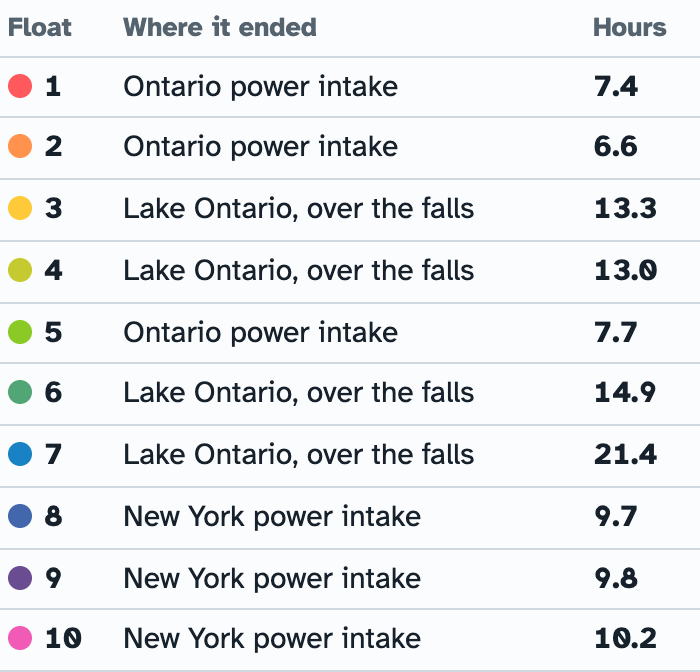
Count the floats in each place. Use Where each float ended.
5
Pick Overnight and do it again.
Each float starts with one tenth of the river behind it.
Screenshots: mrsajdak.com/niagara, Tab 3
PART 3 · LEARN IT · 1 OF 4
Floats are tracers
Scientists drop floats or dye in a river to see where its water goes. A tracer goes wherever its water goes.
Screenshot: mrsajdak.com/niagara, Tab 3
PART 3 · LEARN IT · 2 OF 4
Small samples are rough
Flip a coin 10 times: you might get 4 or 7 heads, not 5. Flip it 1,000 times and you get close to half. Ten floats are a small sample.
Screenshot: mrsajdak.com/niagara, Tab 3
PART 3 · LEARN IT · 3 OF 4
Average speed
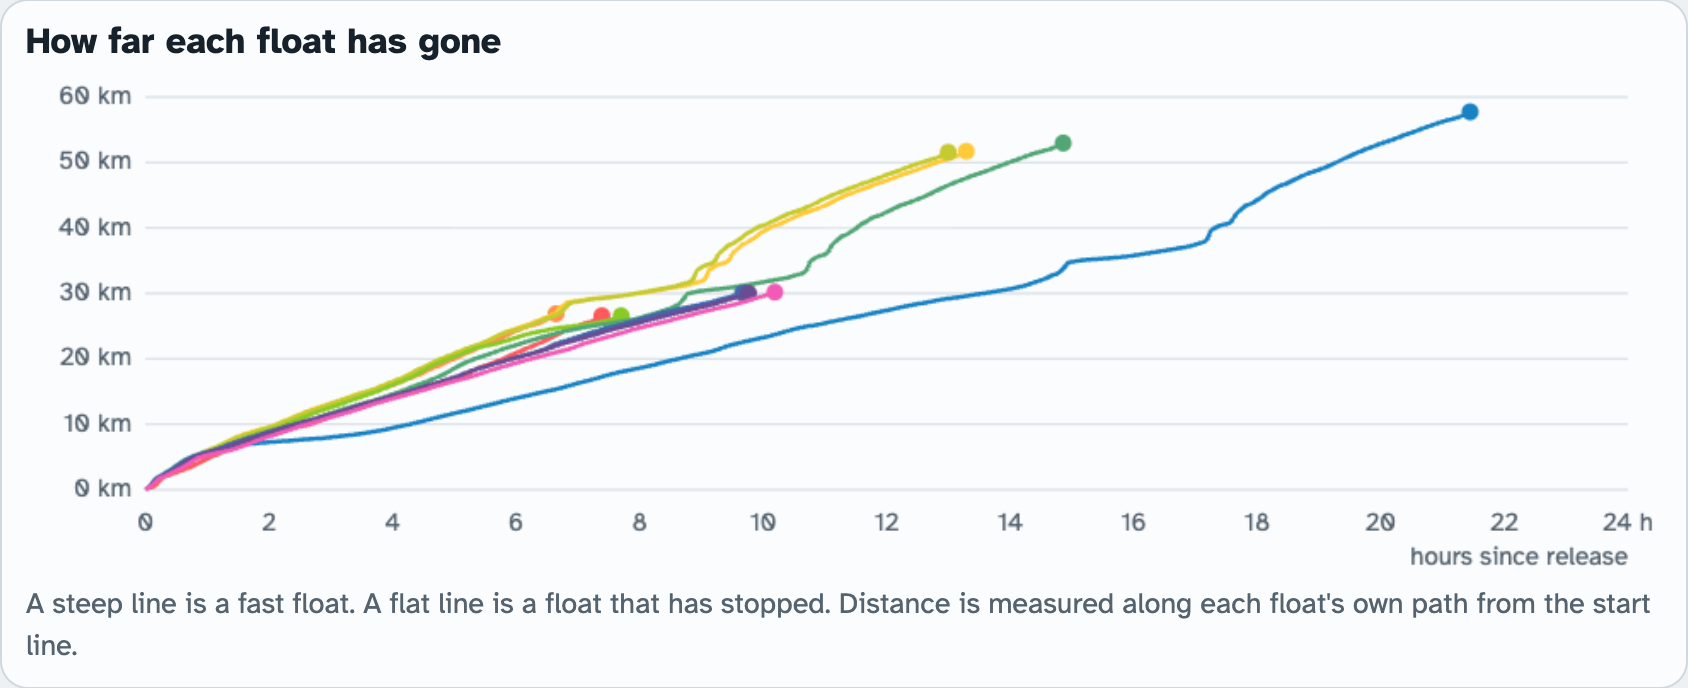
Average speed = total distance ÷ total time, for the whole trip. It does not care how fast the fastest part was.
Screenshot: mrsajdak.com/niagara, Tab 3
PART 3 · LEARN IT · 4 OF 4
Slow parts take the most time
10 km at 60 km/h takes 10 minutes. 2 km of traffic jam at 6 km/h takes 20 minutes. 12 km in 30 minutes is only 24 km/h.
Photo: Óðinn, CC BY-SA 3.0
PART 3 · QUESTION 13
Floats and water
QUESTION 13
Should they match?
Compare your last column in Question 12 with the percent through the plants in Question 7.
Use tracers to explain why the two should be close.
Use sample size to explain why they are not exactly the same.
Screenshot: mrsajdak.com/niagara, Tab 3
PART 3 · QUESTION 14
Time one float, stretch by stretch
1
Go back to Daytime and press Skip to the end.
2
Copy the Checkpoint times table: hours and distance.
3
For each stretch, subtract to get the km and the hours.
4
Speed = km ÷ hours.
A steep line is a fast float.
Example
At hour 1.0 a float is at 2.0 km.
At hour 3.0 it is at 12.0 km.
10.0 ÷ 2.0 = 5 km/h
That is 10.0 km in 2.0 hours.
These are not your numbers. Use your own.
Screenshot: mrsajdak.com/niagara, Tab 3
PART 3 · QUESTION 15
Fast water, slow trip
QUESTION 15
The gorge is not as fast as it looks
The gorge has the fastest station on the river.
But your float's average speed through the whole gorge was not much higher than anywhere else.
Look at Station 4 in your Part 1 table. What does the float do there?
Station 4 is in the gorge too.
Screenshot: mrsajdak.com/niagara, Tab 1
WRAP IT UP · QUESTION 16
How would you share the river?
One side
“Send it all over the falls. It is a natural wonder.”
Other side
“Send more to the power plants. The electricity is made without burning fuel.”
Your choice
Pick a number of m³/s for the falls. Back it with at least two numbers from Part 2.
The cost
Every choice costs something. Name one cost of yours.
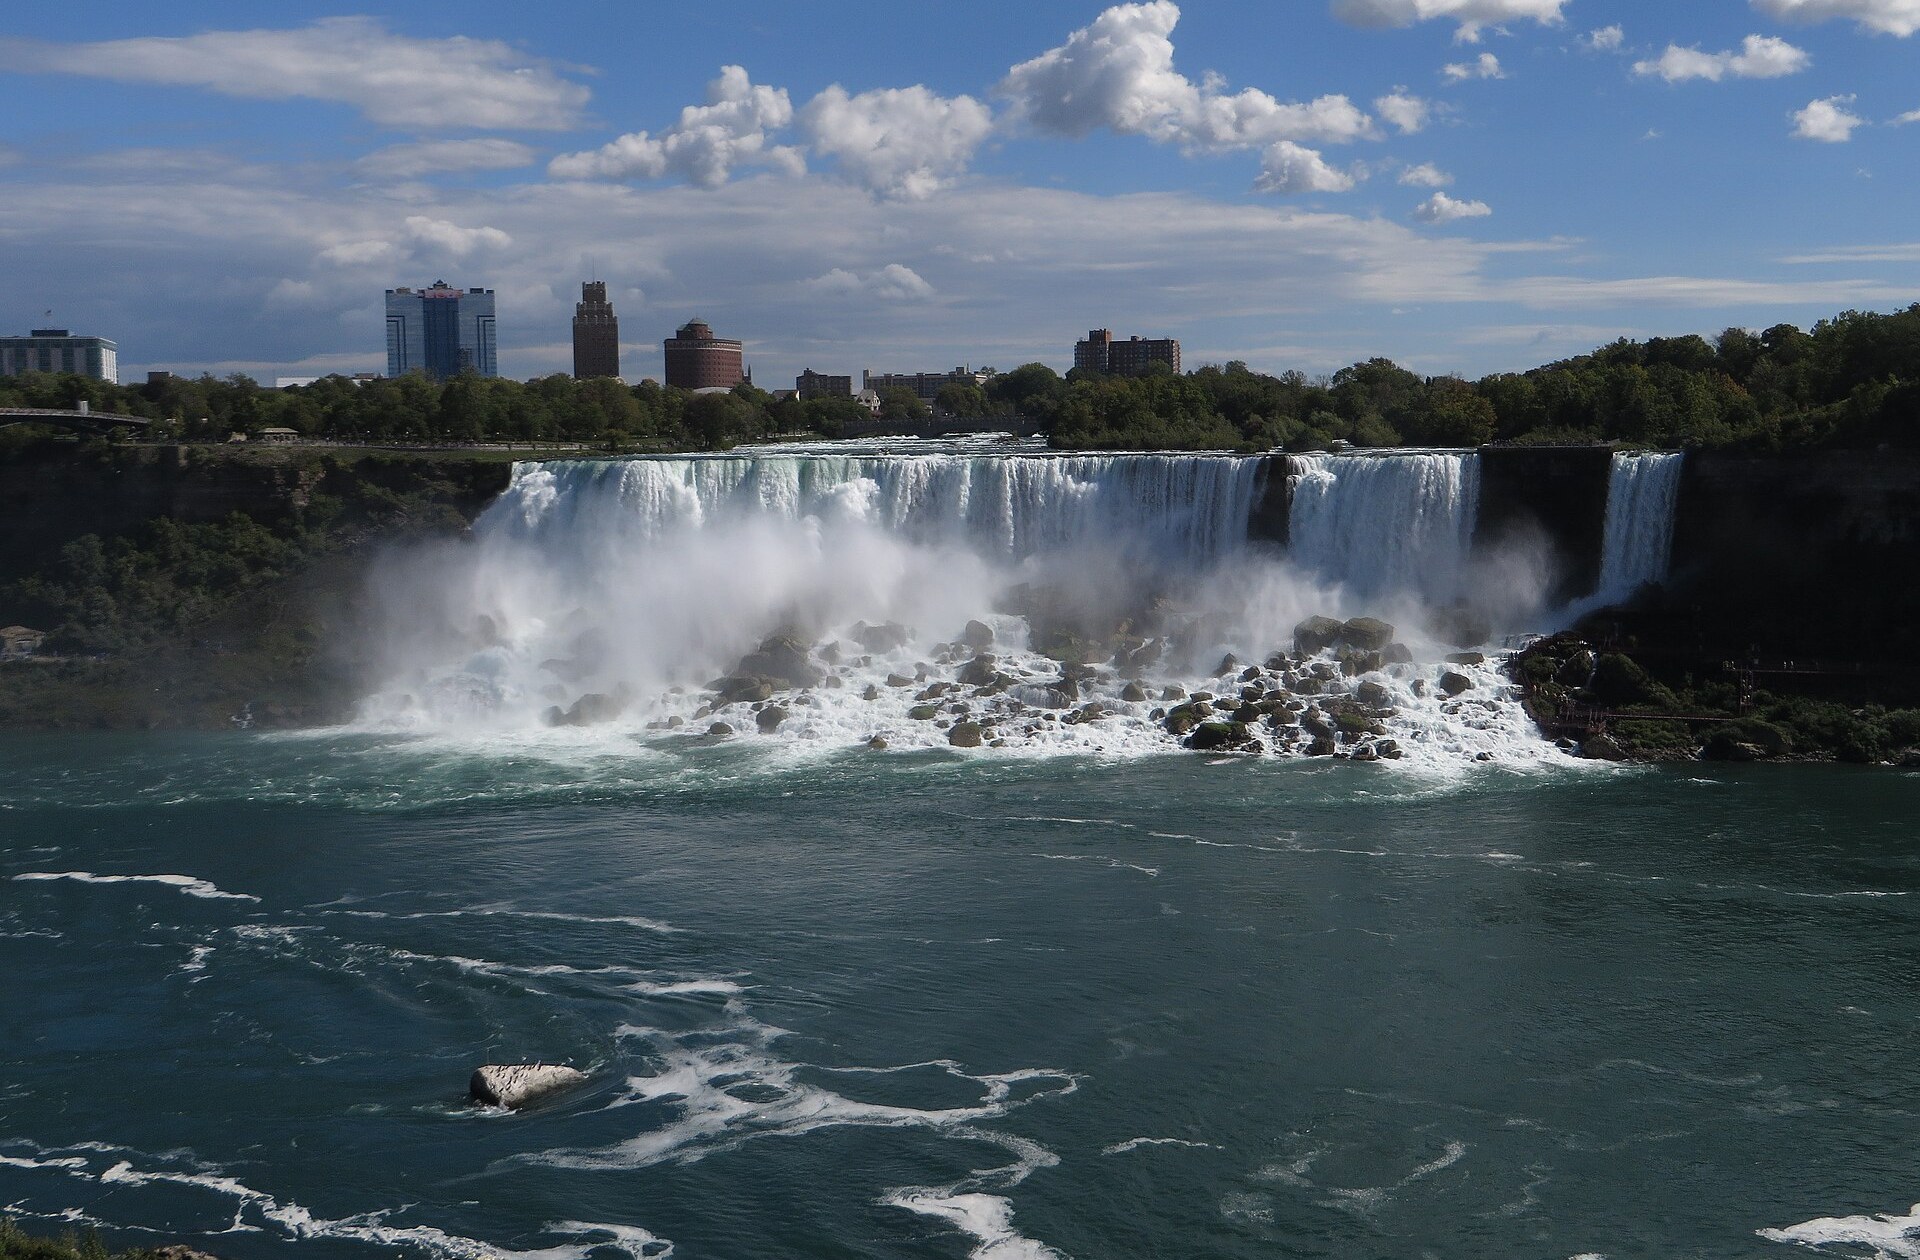
The American Falls on a September day.
Photo: Ken Lund, CC BY-SA 2.0
WRAP IT UP · BACK TO THE START
Revisiting the Phenomenon
Who decides how much water goes over Niagara Falls, and where does the rest of the river go?
1Who decides how much water goes over Niagara Falls? What evidence from the lab shows it?
2Where does the rest of the river go, and where does it come back? Use station numbers.
3In 1969 the American Falls was dry, but the river kept flowing. Use what you know about flow to explain where that water went.
4Tonight the falls will carry less water than at noon. Which numbers from your Question 7 table show this?
LAST CHECK
Before you hand it in
Name, date and period are on top.
All six tables are full.
Every flow and speed has its unit.
Question 16 has two numbers and one cost.
Photo: Jim.henderson, CC BY-SA 4.0