ENVIRONMENTAL SCIENCE · CHAPTER 5
Ecological Succession Lab
Follow along with your worksheet, one question at a time.
mrsajdak.com/succession
Photo: U.S. Fish and Wildlife Service
START HERE
Phenomenon: Life After the Eruption
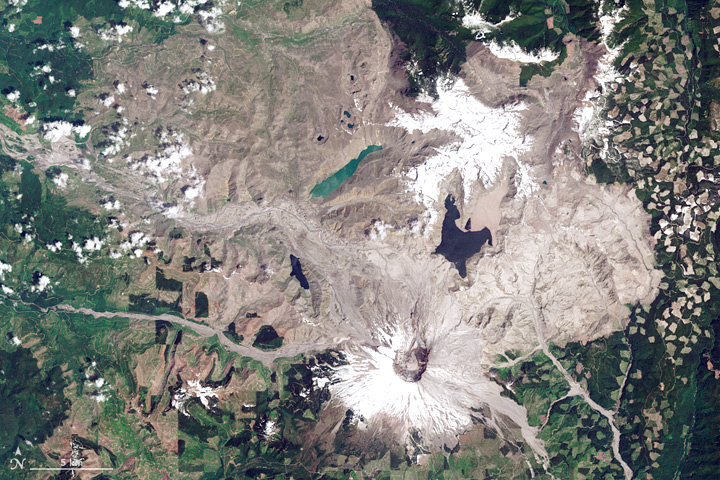
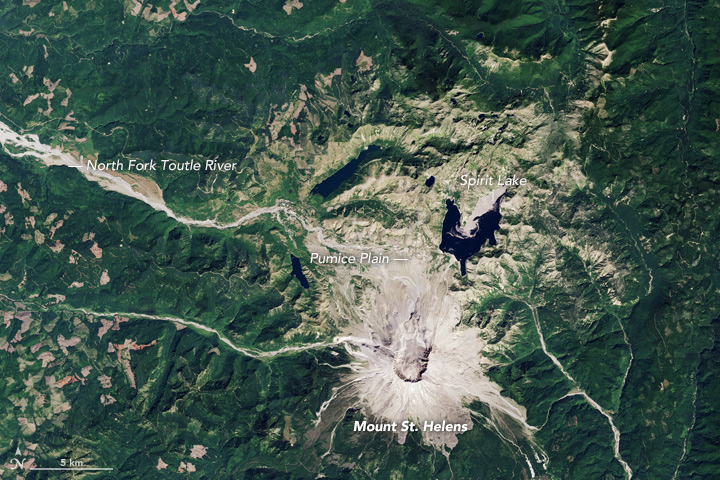
Images: NASA Earth Observatory, made with Landsat data from the U.S. Geological Survey
START HERE
Observe, wonder, predict
These photographs show the same general area after a major natural disaster. One shows widespread destruction, while the other shows plants growing again. How can a place that looks completely destroyed become a living ecosystem again?
OBSERVEWhat differences do you notice between the photographs?
WONDERWhere might the first plants have come from?
PREDICTWould every ecosystem recover at the same speed? Explain your reasoning.
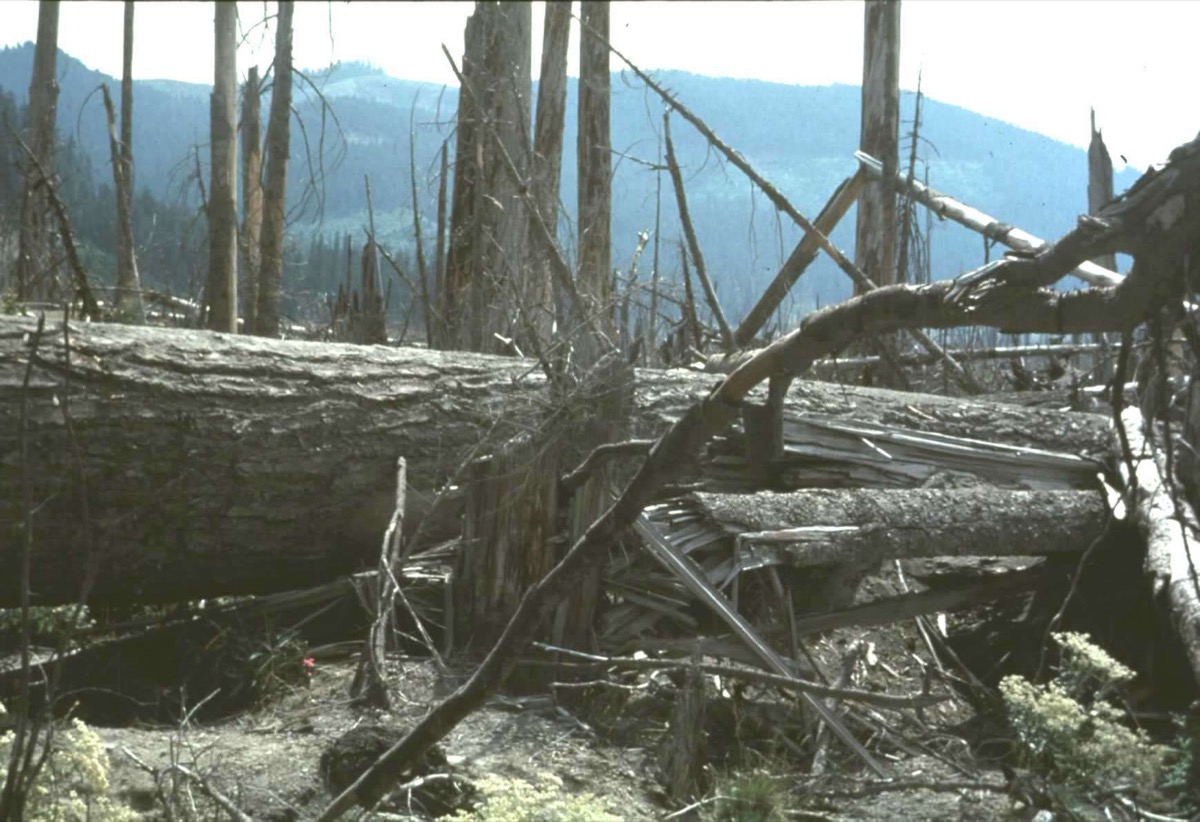
On the ground: one fallen log, 3 years after.
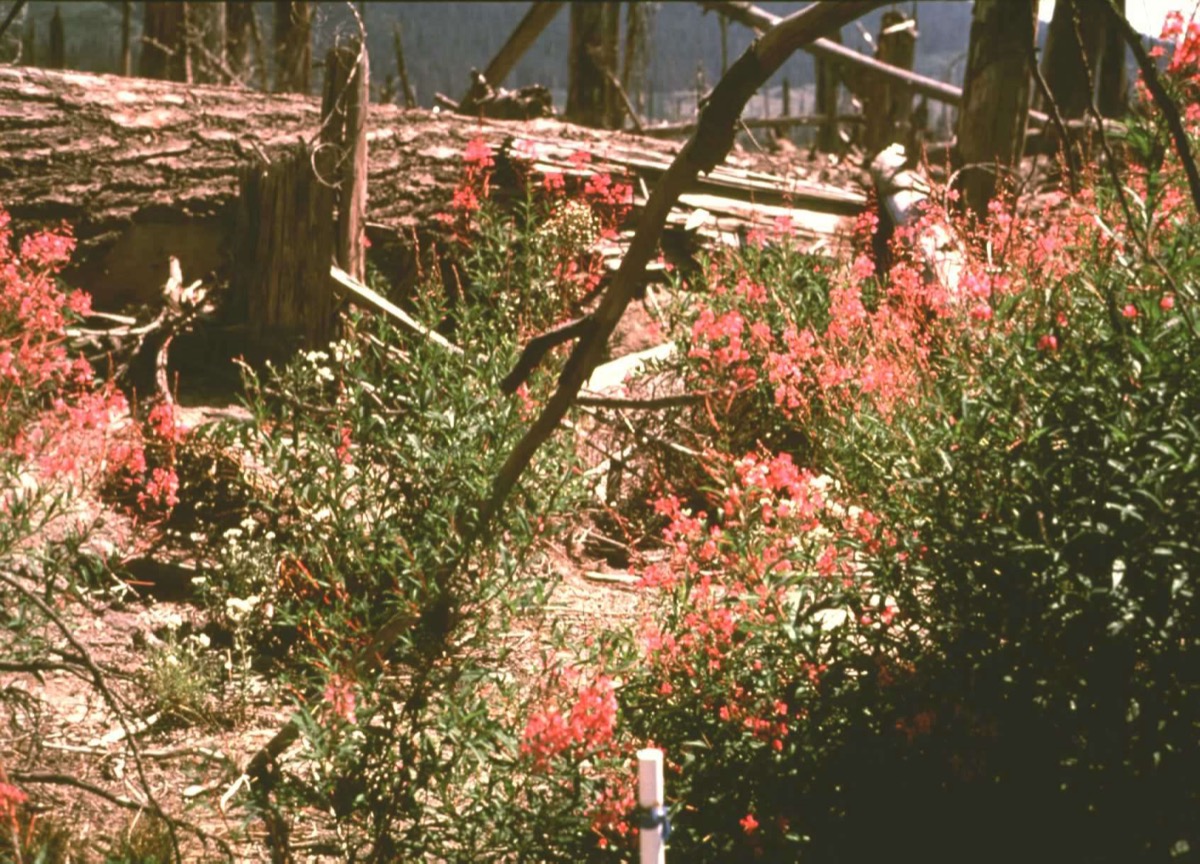
The same log, 3 years later.
Photos: USDA Forest Service, 1983 · P. Frenzen, USDA Forest Service, 1986
DRIVING QUESTION
How do ecosystems recover after a disturbance, and why do some recover faster than others?
START HERE
What Happened Here?
Finished observing? Click here to find out.
On May 18, 1980, Mount St. Helens erupted in Washington State. The eruption destroyed forests, buried landscapes in volcanic material, and dramatically changed the surrounding ecosystems. Scientists studying the aftermath discovered that life returned at different rates depending on conditions at each location. Some areas recovered relatively quickly, while others remained sparsely vegetated for decades.
Today, you will investigate how ecosystems change following disturbances, what influences the rate of recovery, and how scientists use evidence to explain ecological succession. At the end of the investigation, you will analyze real data from Mount St. Helens and return to the original driving question.
BEFORE YOU START
Two ways to start over
The five stages
1. Pioneers
2. Grasses and wildflowers
3. Shrubs
4. Sun-loving trees
5. Mature forest
Each stage changes the place for the next one.
Both can end as a forest. Which gets there first, and by how much?
Photos: Gary Houston, CC0 · Nyttend, public domain
BEFORE YOU START
What you will learn
I can compare primary and secondary succession using numbers for time and soil.
I can use inertia and resilience to predict how a community changes after a disturbance.
BEFORE YOU START
Get set up
1
Open mrsajdak.com/succession on your device.
2
Write your name, the date and your period on the worksheet.
3
Find the three tabs at the top of the lab. Each tab goes with one part of the worksheet.
4
Start on Tab 1. Do not skip ahead.

| Tab in the lab | Worksheet | Questions |
|---|---|---|
| 1. Fast-forward a place | Part 1 | 1 to 5 |
| 2. Disturb it | Part 2 | 6 to 11 |
| 3. Mount St. Helens | Part 3 and Wrap it up | 12 to 16 |
Screenshot: mrsajdak.com/succession
TAB 1 · QUESTIONS 1 TO 5
Part 1. Fast-forward a place
Succession is the slow change in what lives in a place.
You will run two places through hundreds of years. Watch what shows up first.
Photo: gailhampshire, CC BY 2.0
PART 1 · TAB 1
Run a place through time
1
Pick Bare rock.
2
Press Play. Or drag the year slider.
3
Watch the box in the corner of the picture. It shows the year, the stage and the numbers.
4
Go all the way to the end. The rock ends at year 600.
5
Then pick Empty city lot. Run it to the end too. The lot ends at year 150.
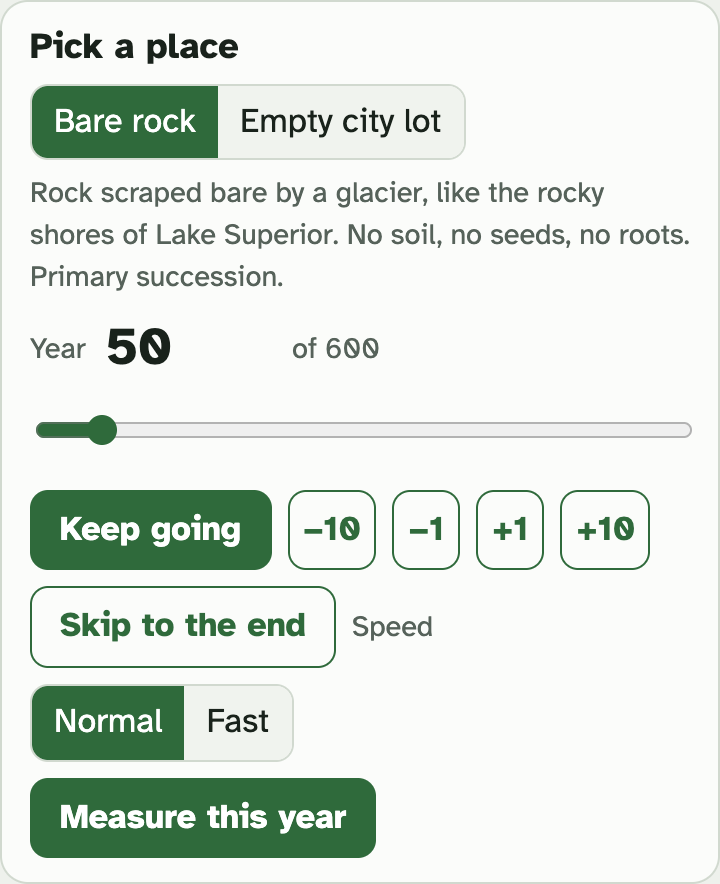
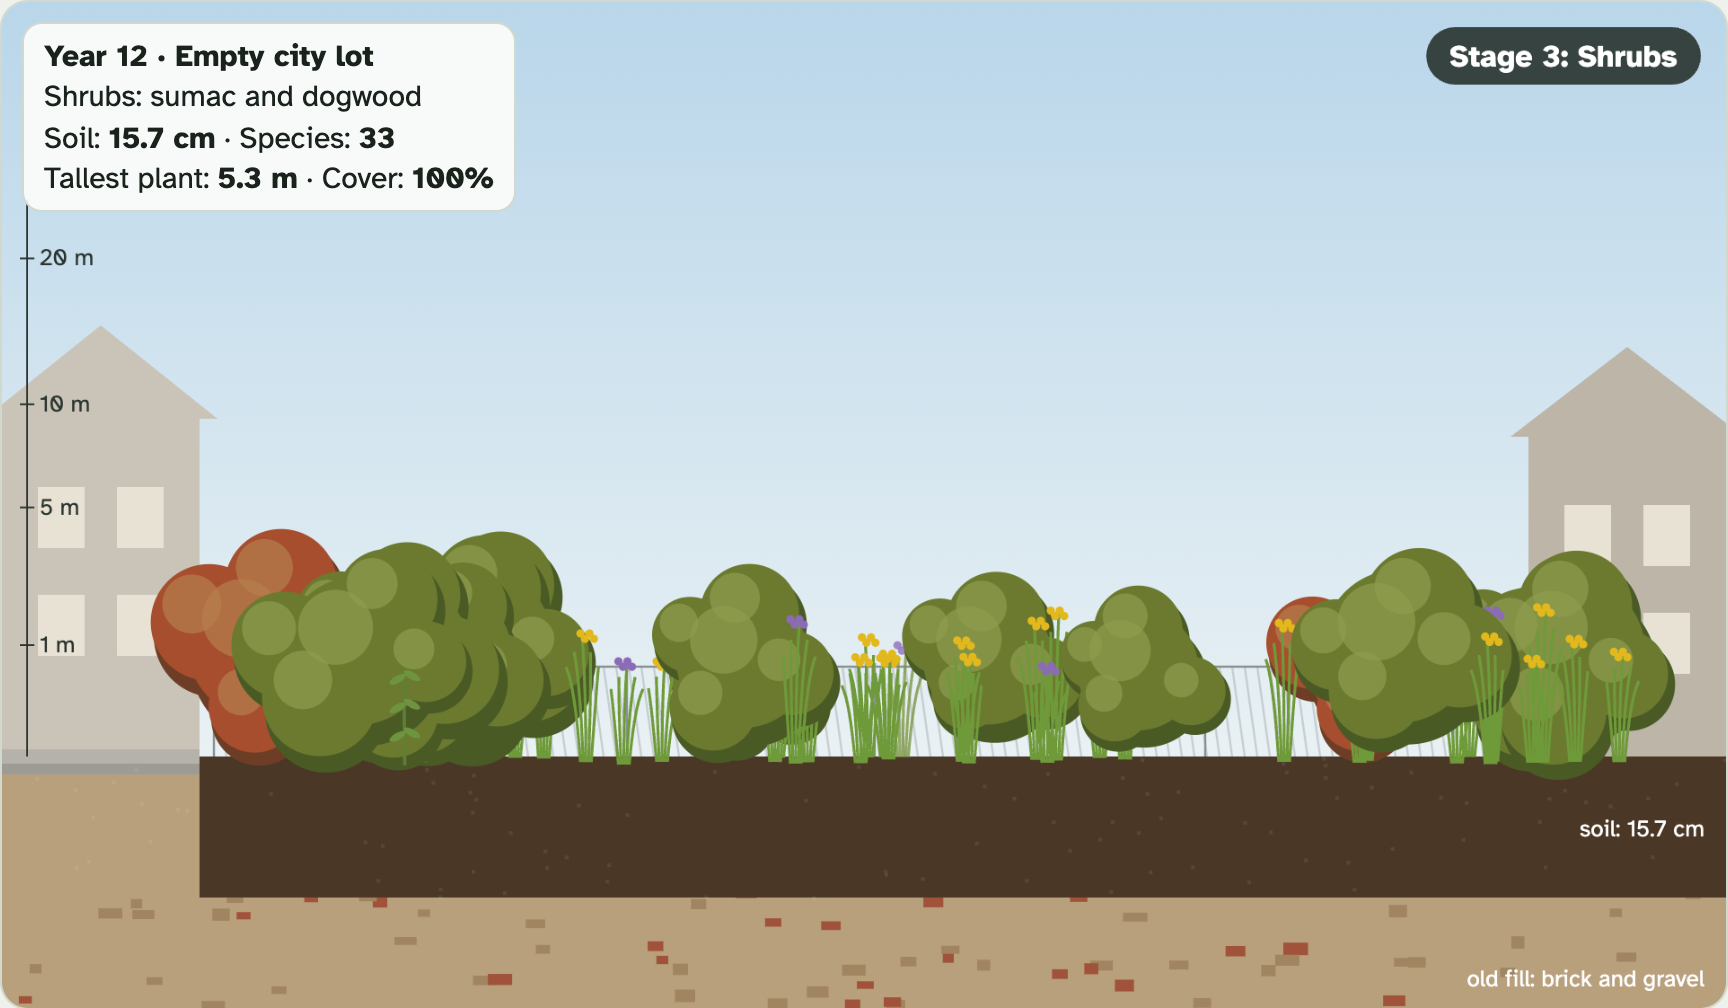
The −1, +1, −10 and +10 buttons move a few years at a time.
Skip to the end jumps to the last year.
Screenshots: mrsajdak.com/succession, Tab 1
PART 1 · QUESTION 1
When does each stage begin?
1
Find the Stages reached box in the lab.
2
Copy the year each stage begins. Do the rock column and the lot column.
3
For each stage, divide the rock year by the lot year.
4
Write how many times as long the rock takes.
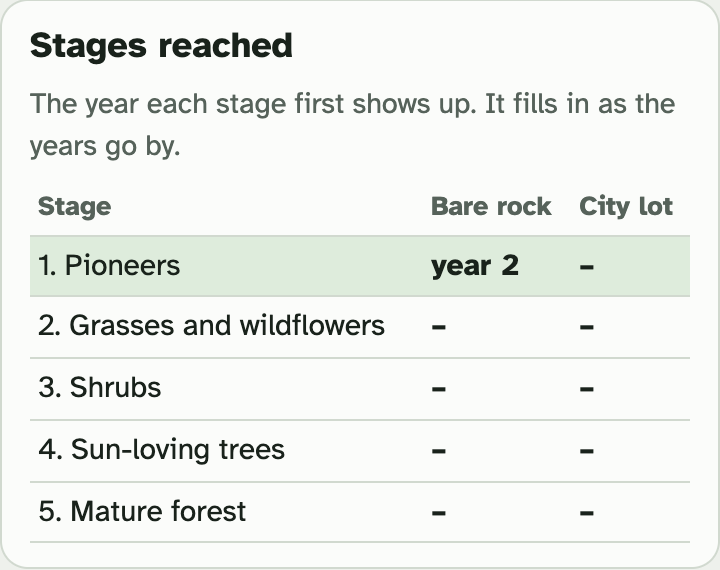
Example
A stage begins in year 80 on the rock.
It begins in year 4 in the lot.
80 ÷ 4 = 20
The rock takes 20 times as long.
These are not your numbers. Use your own.
Screenshot: mrsajdak.com/succession, Tab 1
PART 1 · QUESTION 2
Measure year 20 and year 100
1
Pick Bare rock. Set the year to 20. Use the slider, then the +1 and −1 buttons.
2
Press Measure this year.
3
Set the year to 100. Measure again.
4
Do the same two years for the city lot.
5
Copy the four rows from Your measurements.
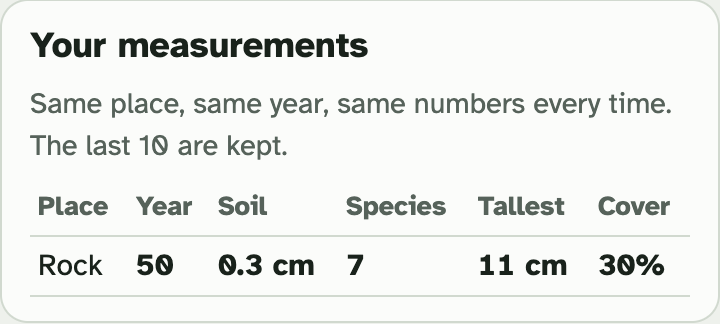
| Soil depth | How deep the soil is, in cm. |
| Plant species | How many kinds of plants live there. |
| Tallest plant | Check the unit. It may be cm or m. |
| Plant cover | How much of the ground has plants on it. |
Screenshot: mrsajdak.com/succession, Tab 1
PART 1 · LEARN IT · 1 OF 4
Pioneer species come first
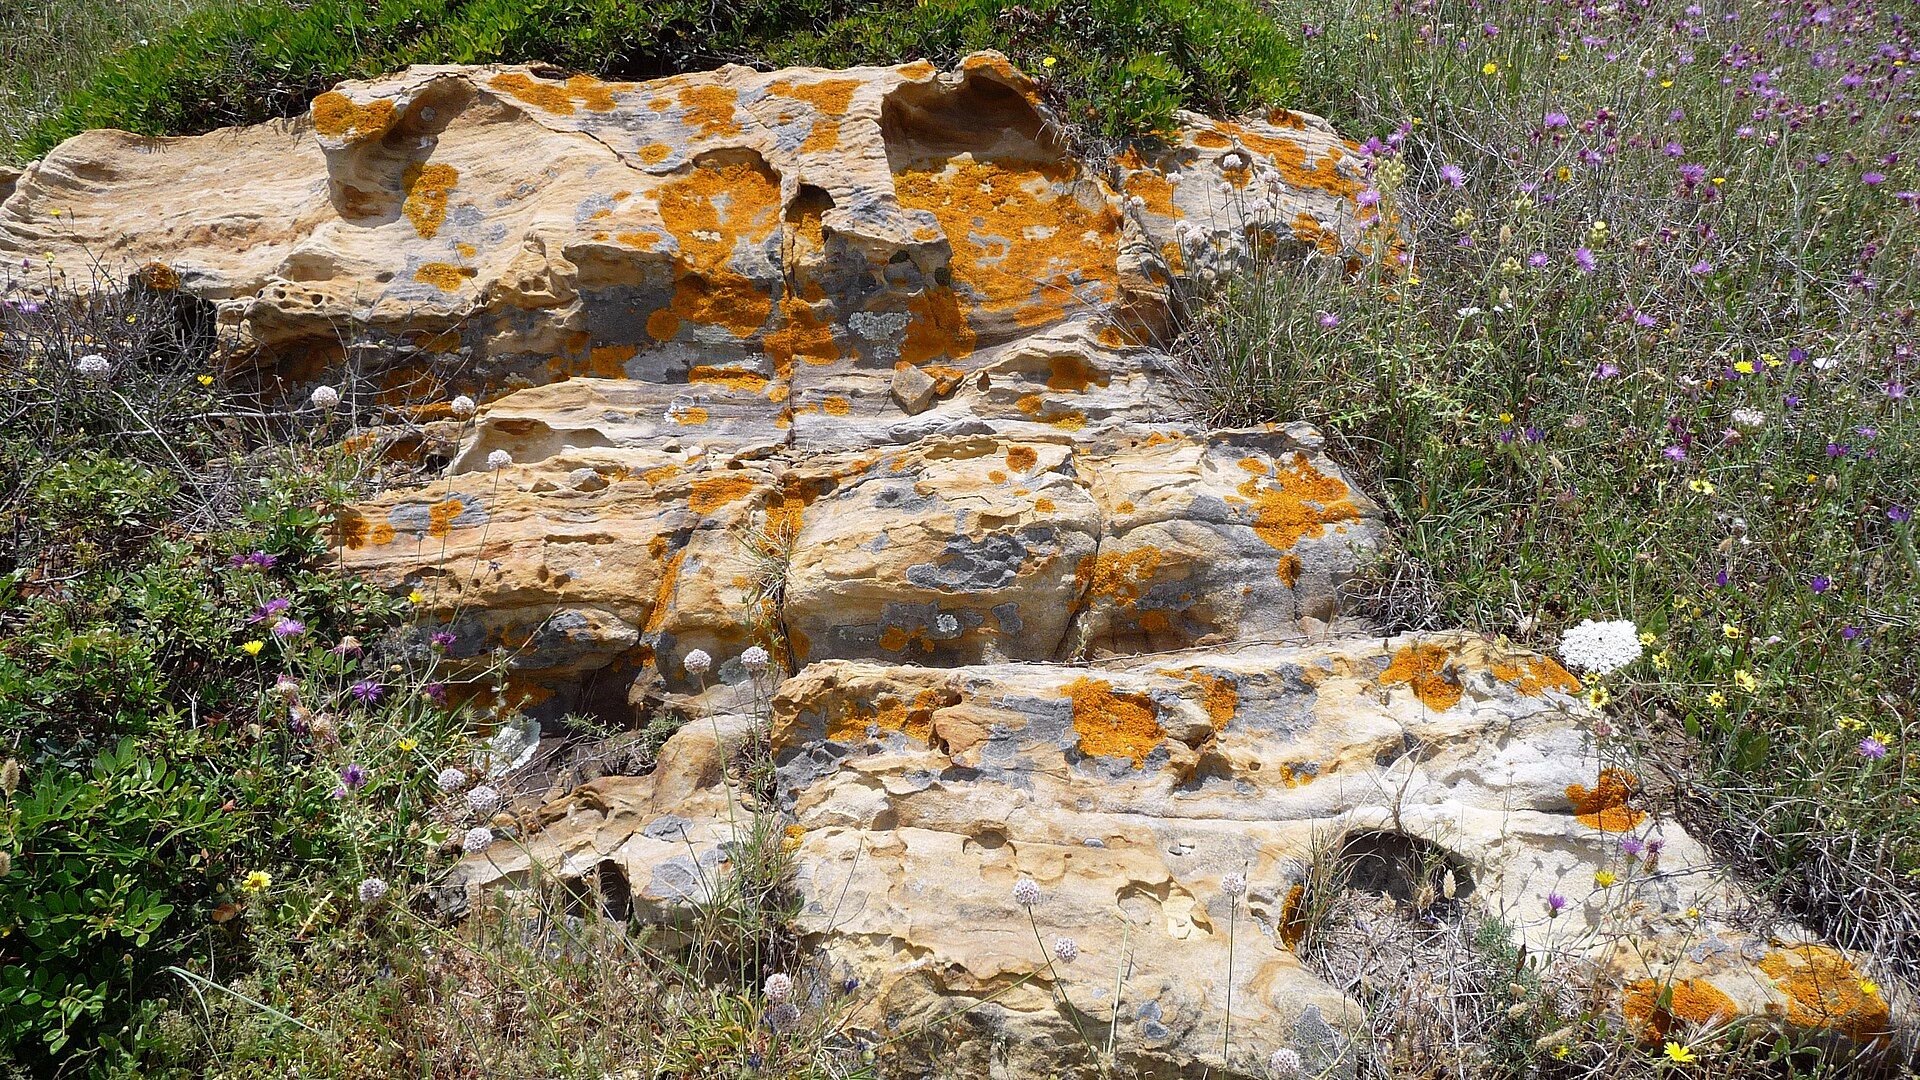
On bare rock, the first living things are lichens. A lichen needs no soil. It grips the rock and gives off a weak acid. The acid breaks the rock into tiny bits.
Photo: gailhampshire, CC BY 2.0
PART 1 · LEARN IT · 2 OF 4
Soil has to be made
Lichens and then mosses die and rot. The rot mixes with the rock bits. That mix is the first thin soil. Even 1 cm takes about 100 years.
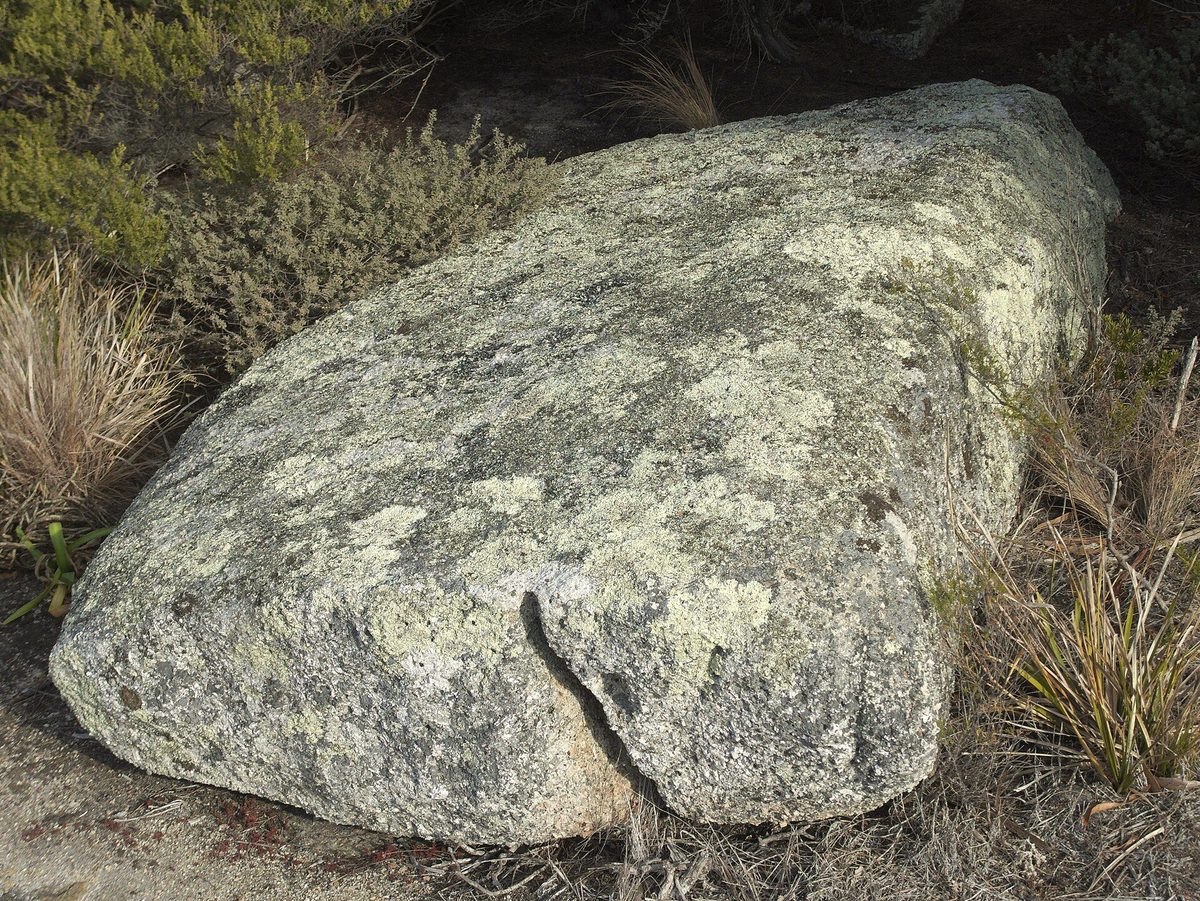
Photo: Gary Houston, CC0
PART 1 · LEARN IT · 3 OF 4
Soil is the shortcut
Bare rock starts with no soil: primary succession. The city lot kept its soil, seeds and roots: secondary succession. Plants can grow right away.
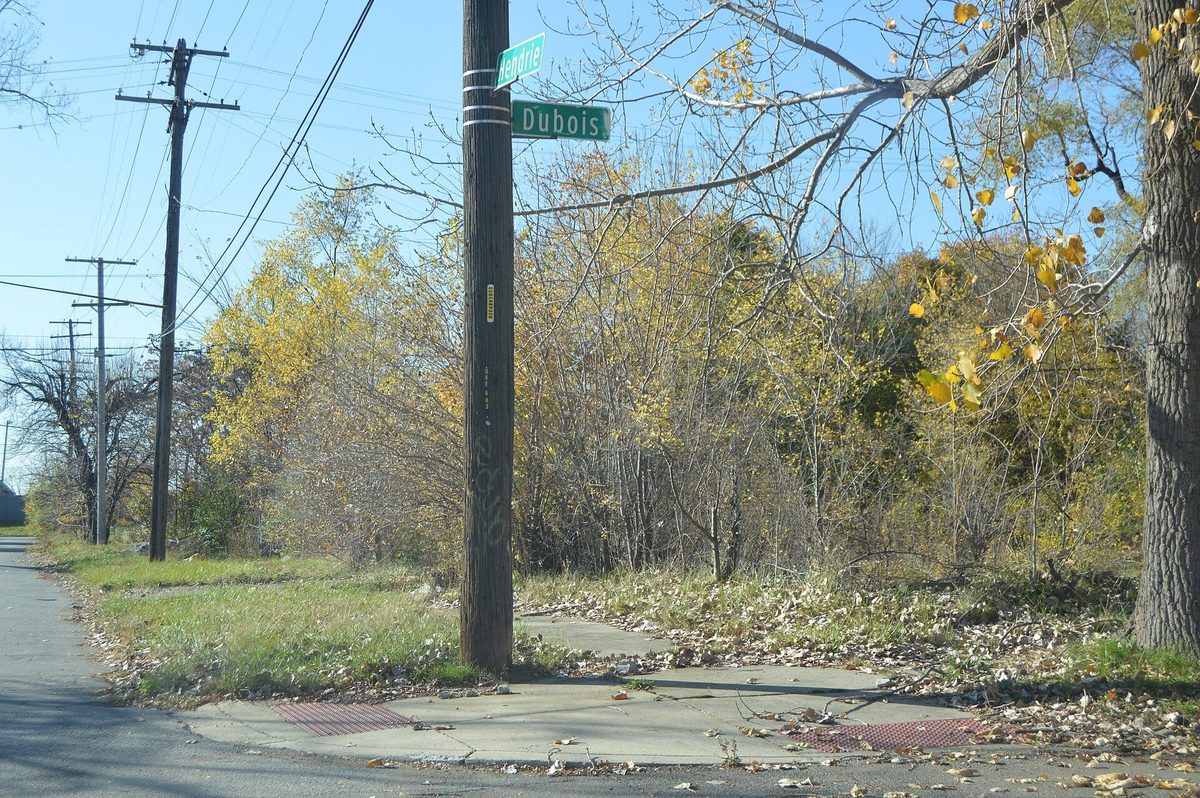
Photo: Nyttend, public domain
PART 1 · LEARN IT · 4 OF 4
Each stage changes the place
Tall trees make shade. Sun-loving plants cannot grow in it. Trees that can grow in shade take over. That is the mature forest.
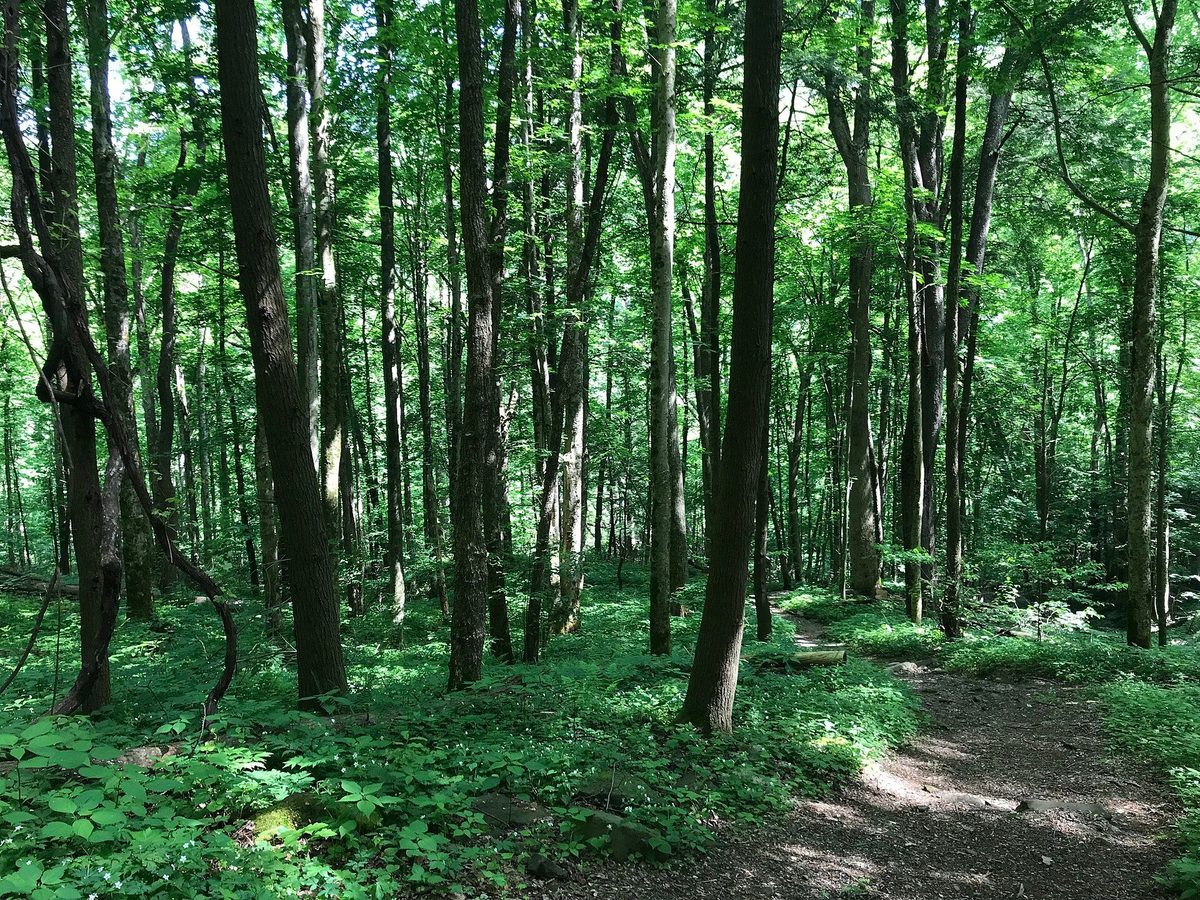
Photo: Great Smoky Mountains National Park
PART 1 · QUESTIONS 3 TO 5
Explain what you saw
QUESTION 3
First
Pioneer species
Name the pioneers you saw on bare rock in the first 50 years.
In your own words, how do they start to make soil?
QUESTION 4
5 ×
Why is the lot faster?
The lot gets to a mature forest about 5 times faster.
Compare the soil at year 20 in your Question 2 table. Use a number.
QUESTION 5
Peak
Up, then down
On the graph, press Plant species. Read the top of the lot’s line. Then read the end.
Use the word shade to explain the drop.
TAB 2 · QUESTIONS 6 TO 11
Part 2. Disturb it
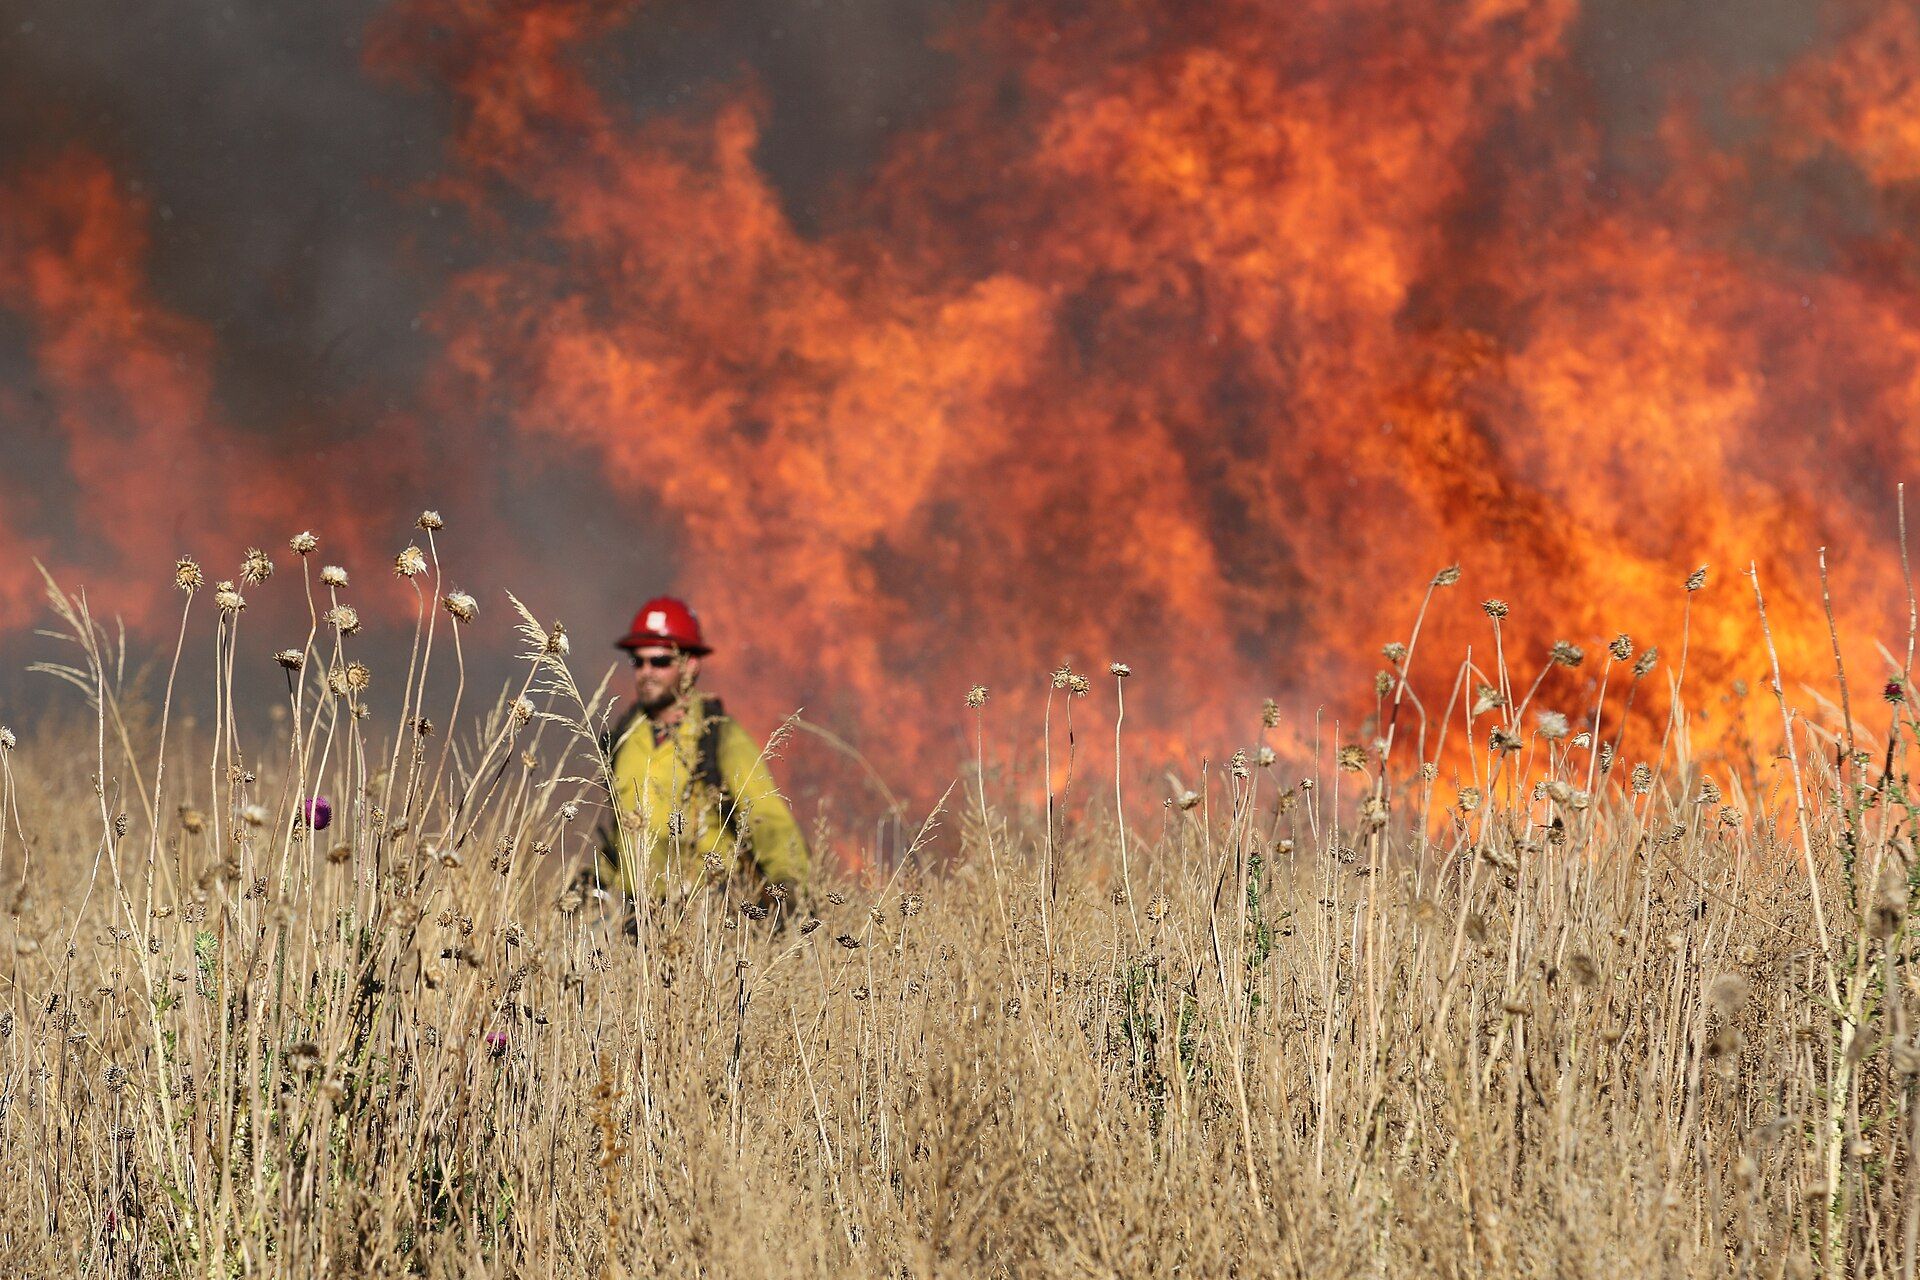
A disturbance is something that damages a community. A fire, a flood, a windstorm, a bulldozer.
You will hit three communities. Then you will time how fast each one comes back.
Photo: U.S. Fish and Wildlife Service
PART 2 · TAB 2
Three communities
Which is hardest to damage? Which comes back fastest? Is it the same one?
Photos: Jasper Shide, CC0 · Great Smoky Mountains National Park · Vyacheslav Argenberg, CC BY 4.0
PART 2 · TAB 2
Predict, then run
1
In Set it up, pick the community and the disturbance. Pick Large (all).
2
In Predict first, pick how much it will change. Pick how fast it will come back.
3
Press Run. Or press Skip to the end.
4
Find Your runs. Copy Change and Back to 90%.
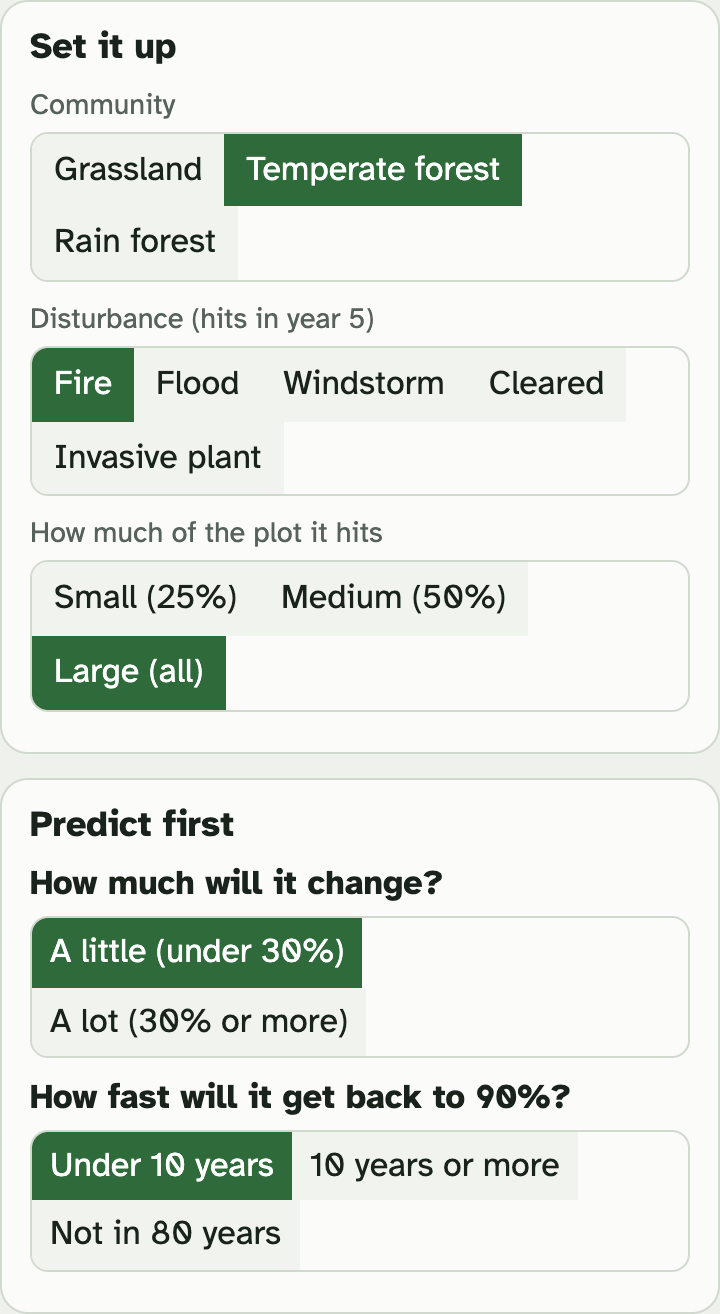
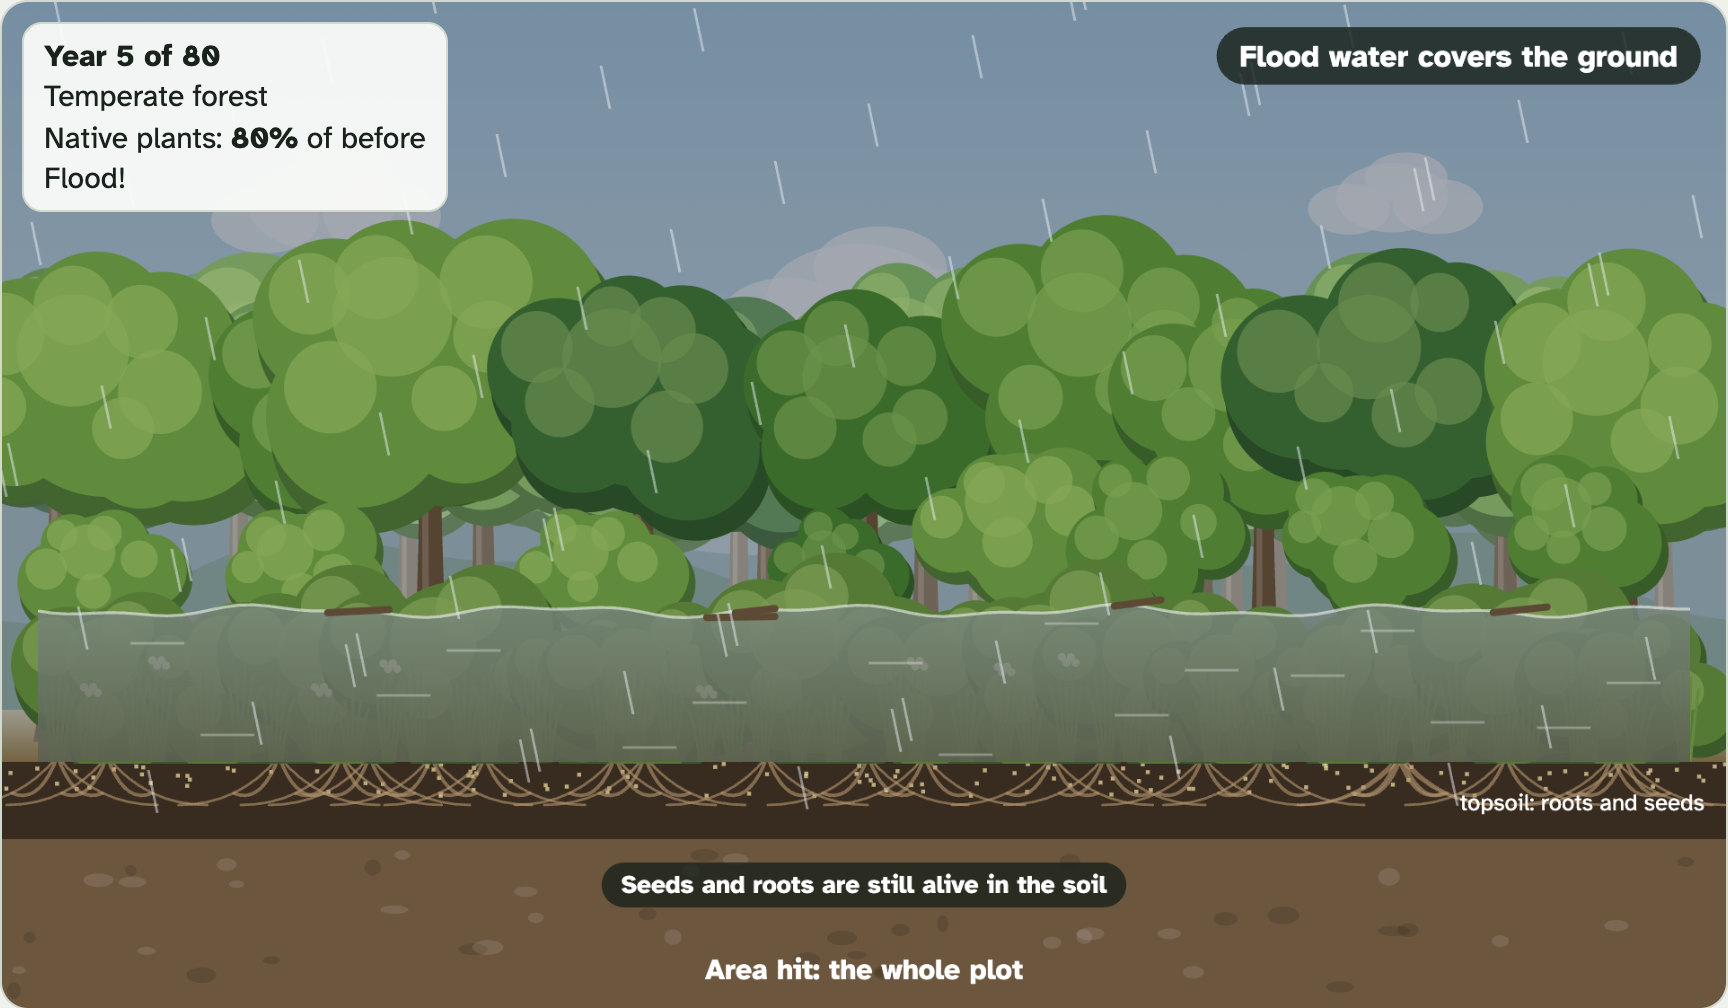
The disturbance hits in year 5. The run ends at year 80.
A wrong prediction is fine. Make it before you run.
Screenshots: mrsajdak.com/succession, Tab 2
PART 2 · QUESTION 6
Your six runs
| Run | Community | Disturbance |
|---|---|---|
| 1 | Grassland | Fire |
| 2 | Grassland | Cleared |
| 3 | Temperate forest | Fire |
| 4 | Temperate forest | Cleared |
| 5 | Rain forest | Fire |
| 6 | Rain forest | Cleared |
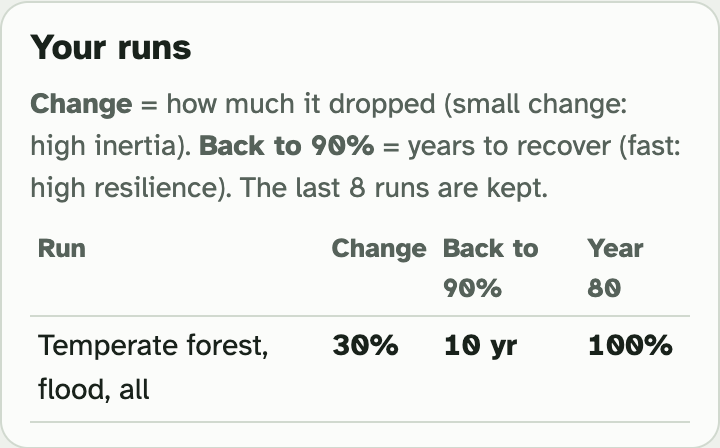
Change is how much the community dropped.
Back to 90% is how many years it took to recover. If the lab says not in 80 yr, write that.
Screenshot: mrsajdak.com/succession, Tab 2
PART 2 · QUESTION 7
Two more runs
QUESTION 7
Does size matter?
Run Temperate forest, Windstorm, Small (25%). Write the change.
Run it again at Large (all). Write the change.
QUESTION 7
An invader moves in
Run Temperate forest, Invasive plant, Large.
Write the native plants at year 80. It is the last column in Your runs.
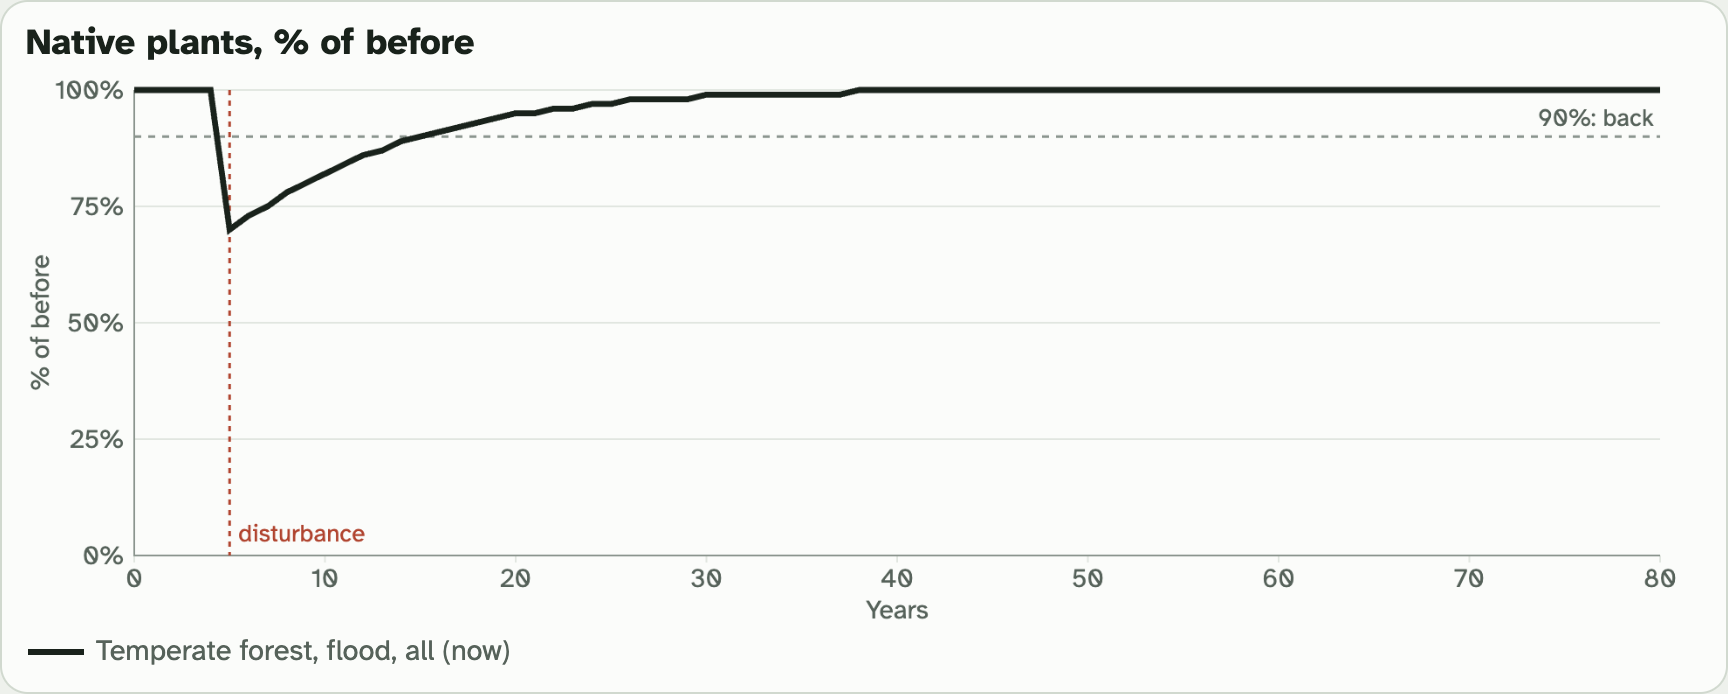
The graph shows native plants as a percent of before.
The dotted line is 90%. Back over the line means recovered.
Screenshot: mrsajdak.com/succession, Tab 2
PART 2 · LEARN IT · 1 OF 4
Inertia: holding up
Inertia is how well a community holds up while it is being hit. Read it from the Change column. A small change means high inertia.
Photo: U.S. Fish and Wildlife Service
PART 2 · LEARN IT · 2 OF 4
Resilience: coming back
Resilience is how fast a community comes back afterward, through secondary succession. Read it from the Back to 90% column. Few years means high resilience.
Photo: U.S. Fish and Wildlife Service
PART 2 · LEARN IT · 3 OF 4
Not the same thing
Prairie grass lives mostly underground, so it grows back fast after a fire. A rain forest keeps its nutrients in the trees. Clear the trees, and the nutrients go too.
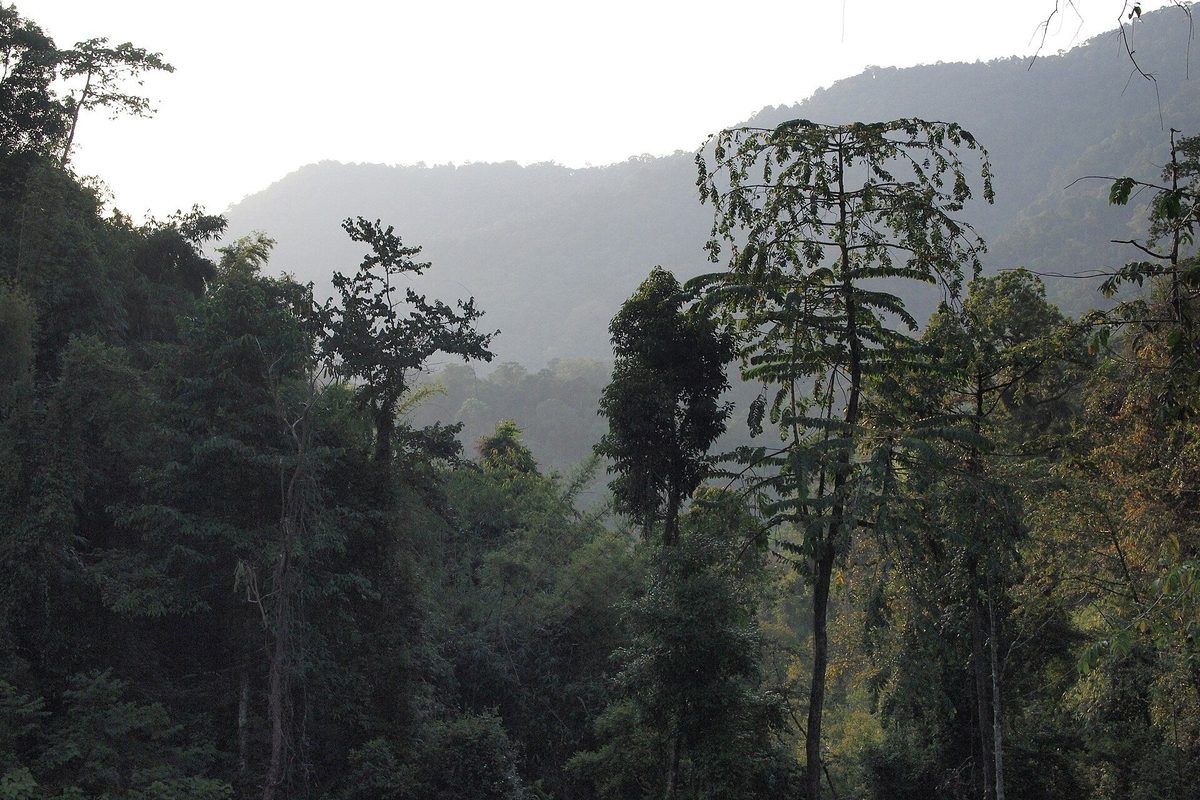
Photo: Vyacheslav Argenberg, CC BY 4.0
PART 2 · LEARN IT · 4 OF 4
Size, and trouble that stays
A small disturbance leaves plants and seeds nearby to spread back. A fire ends in a day. An invasive plant stays and keeps spreading.
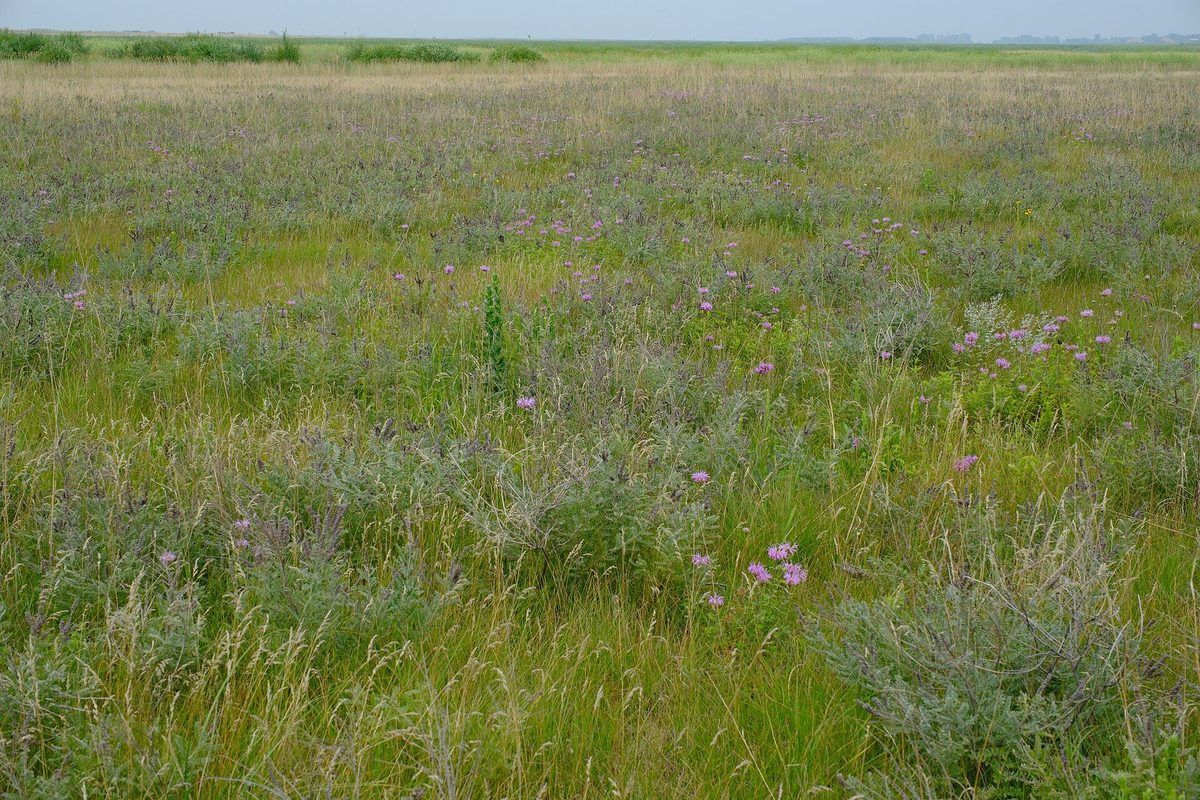
Photo: Jasper Shide, CC0
PART 2 · QUESTIONS 8 TO 10
Use the two strengths
QUESTION 8
Inertia
Hard to damage
Look at your fire columns. Which community changed the least? Give its number.
QUESTION 9
Resilience
Quick to come back
Look at your cleared columns. Which came back fastest? Which was slowest? Give numbers.
QUESTION 10
Agree?
“Hard to damage means fast to bounce back.”
Find the rain forest’s two numbers: its change in a fire, and its years back after clearing.
Argue for or against.
PART 2 · QUESTION 11
Size, and a disturbance that stays
QUESTION 11a
Does size matter?
Use your two windstorm numbers from Question 7.
How does the size of a disturbance change the effect?
QUESTION 11b
Why no comeback?
Use your invasive plant number from Question 7.
A fire ends. Why does the forest not come back after the invader the way it does after a fire?
TAB 3 · QUESTIONS 12 TO 15
Part 3. Mount St. Helens
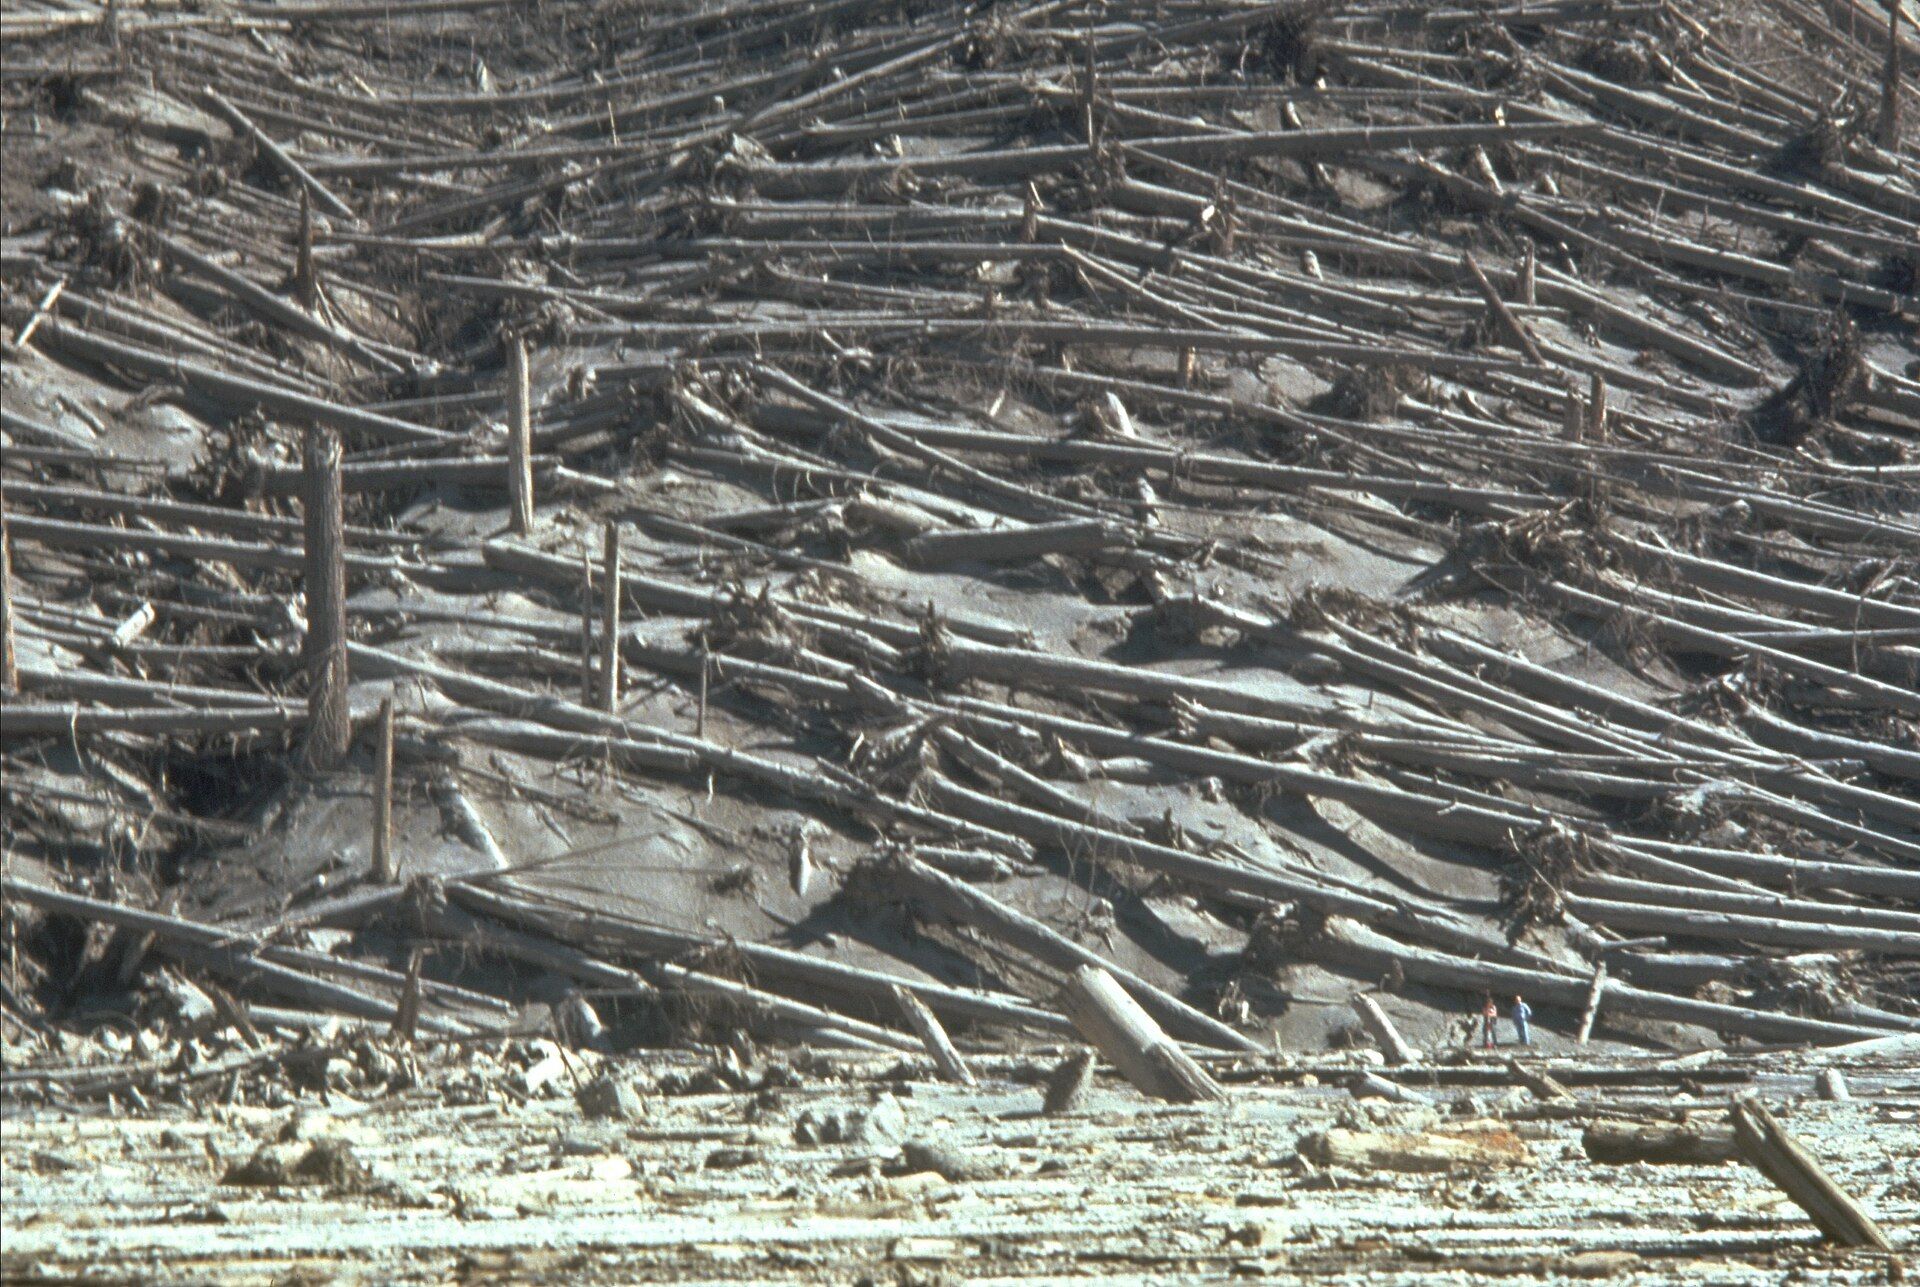
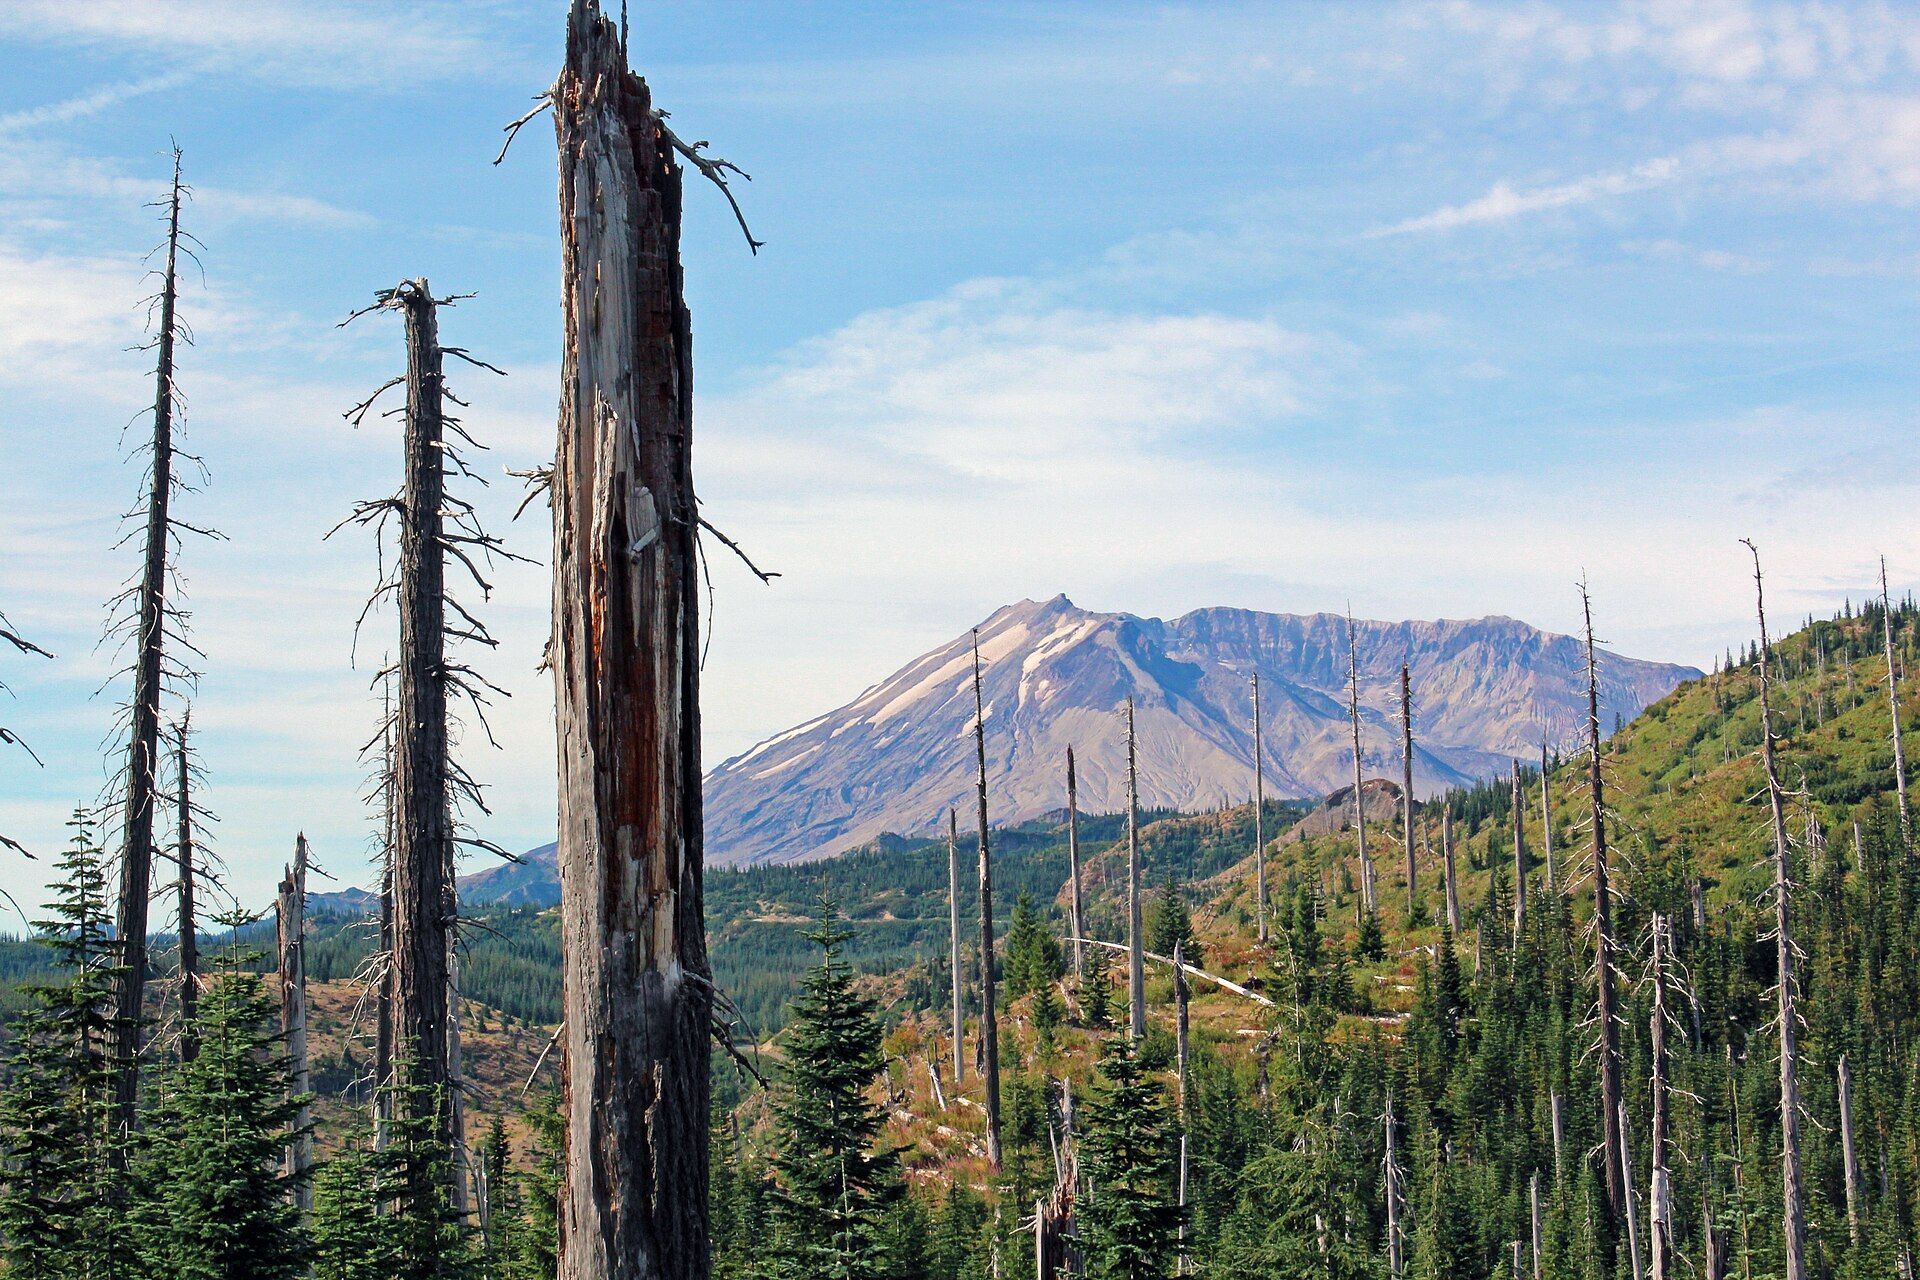
On May 18, 1980, this volcano in Washington State erupted. The blast knocked whole forests flat.
Ecologist Roger del Moral went back almost every summer to measure the plants. These are his real numbers.
Photo: Lyn Topinka, U.S. Geological Survey
PART 3 · QUESTION 12
Read the real data
1
Pick a site. Start with Studebaker Ridge.
2
Slide to the first year the site was measured. The note under the site names tells you when the plots were set up.
3
Press Record this year. Copy the plant cover.
4
Do the same for 1990. Then for the last year measured.
5
Repeat for Pine Creek and Butte Camp.
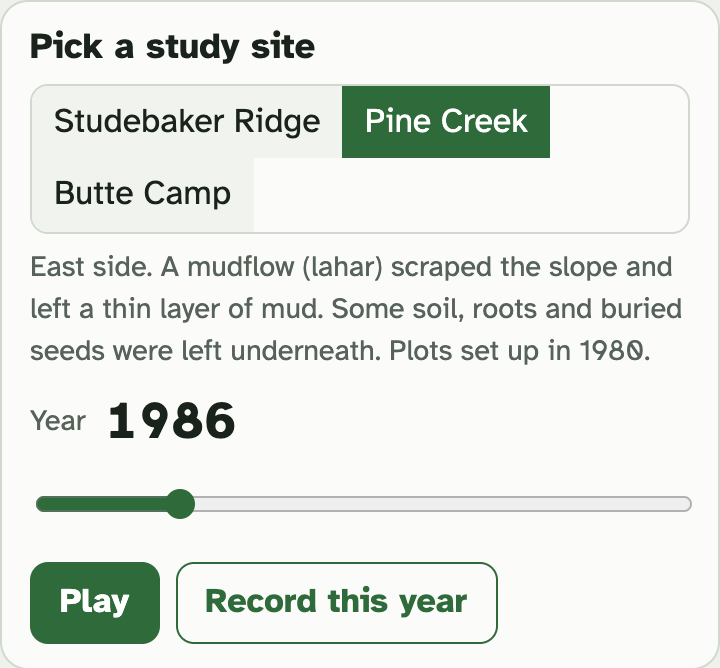
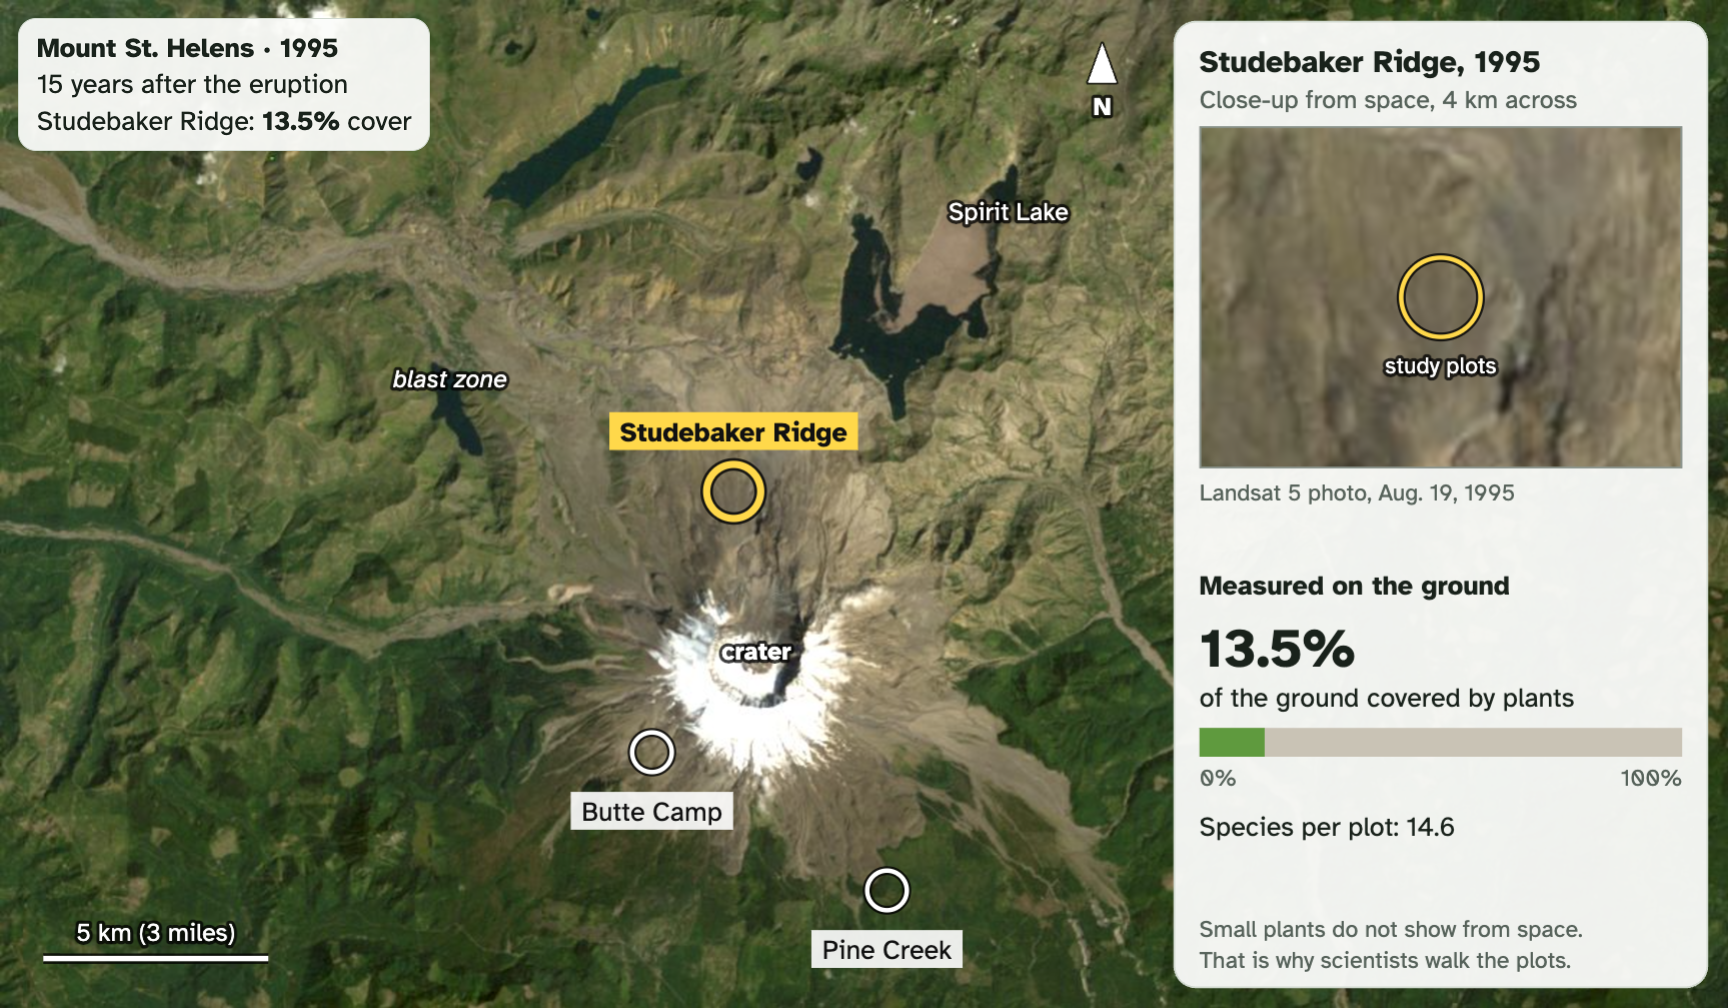
The pictures are real satellite photos. Grey is bare ground. Green is plants.
No survey that year? The lab shows the last one and tells you.
Screenshots: mrsajdak.com/succession, Tab 3
PART 3 · QUESTION 12
The first year at 10%
1
Look at the graph. Find the dotted line at 10% cover.
2
Follow one site’s line. Find the first dot on or above the dotted line.
3
Move the slider to that year. Check the number.
4
Subtract 1980. That is the years after the eruption.
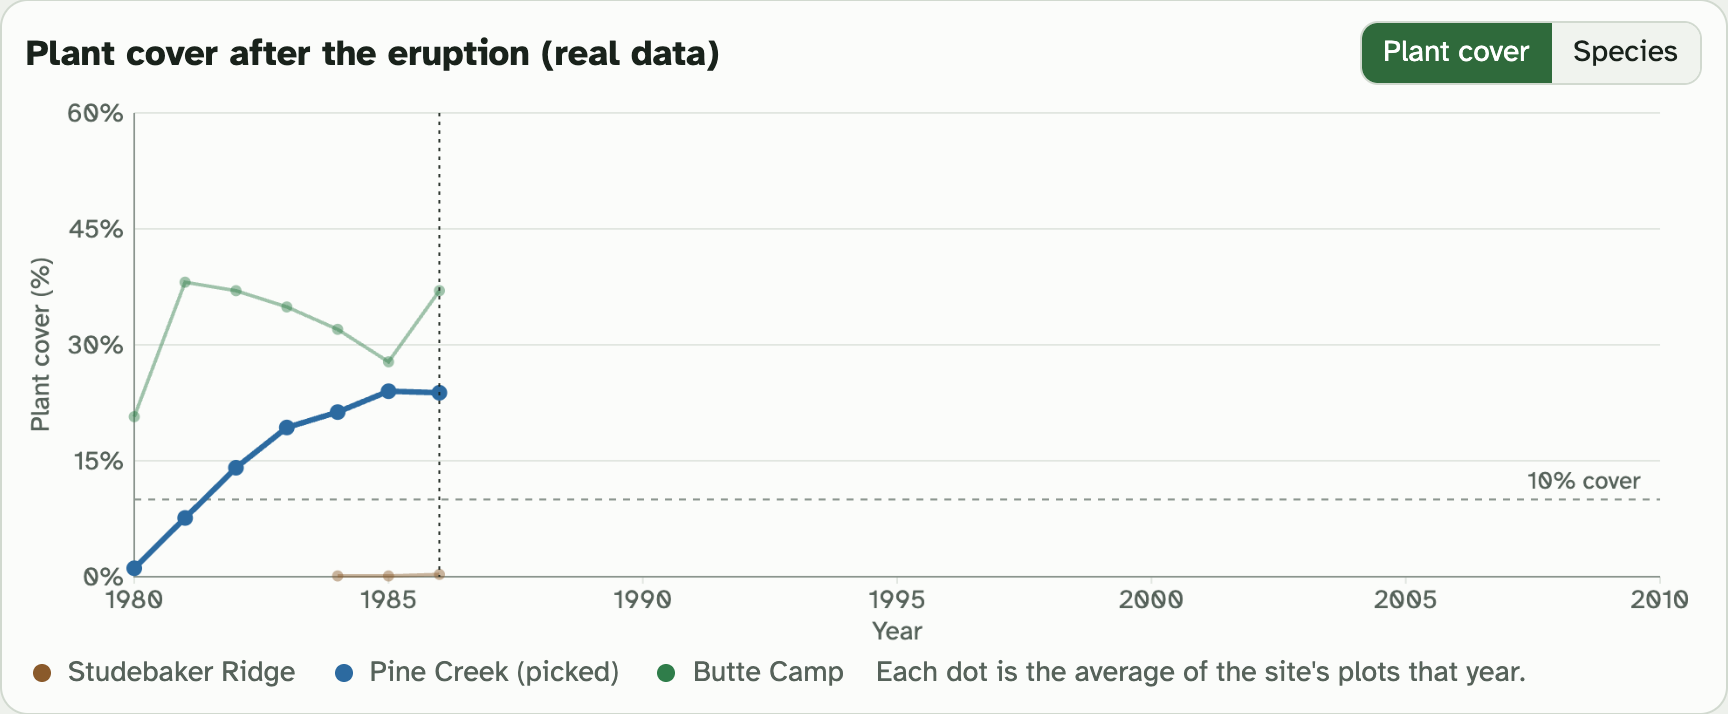
Example
1987 − 1980 = 7
A site that first reaches 10% in 1987 took 7 years. Not your numbers.
Screenshot: mrsajdak.com/succession, Tab 3
PART 3 · LEARN IT · 1 OF 4
What was left decides it
No soil, roots or seeds left: primary succession. Soil, roots or buried seeds left: secondary succession. Plants hurt but still alive just grow back.
Photo: Lyn Topinka, U.S. Geological Survey
PART 3 · LEARN IT · 2 OF 4
Nitrogen is missing
Plants need nitrogen to grow. Fresh volcanic rock has almost none. Air is mostly nitrogen, but plants cannot use it straight from the air.
Photo: USDA Forest Service, 1983
PART 3 · LEARN IT · 3 OF 4
Nitrogen fixation
Lupines have bacteria in small bumps on their roots. The bacteria turn nitrogen from the air into a form plants can use. This is nitrogen fixation.
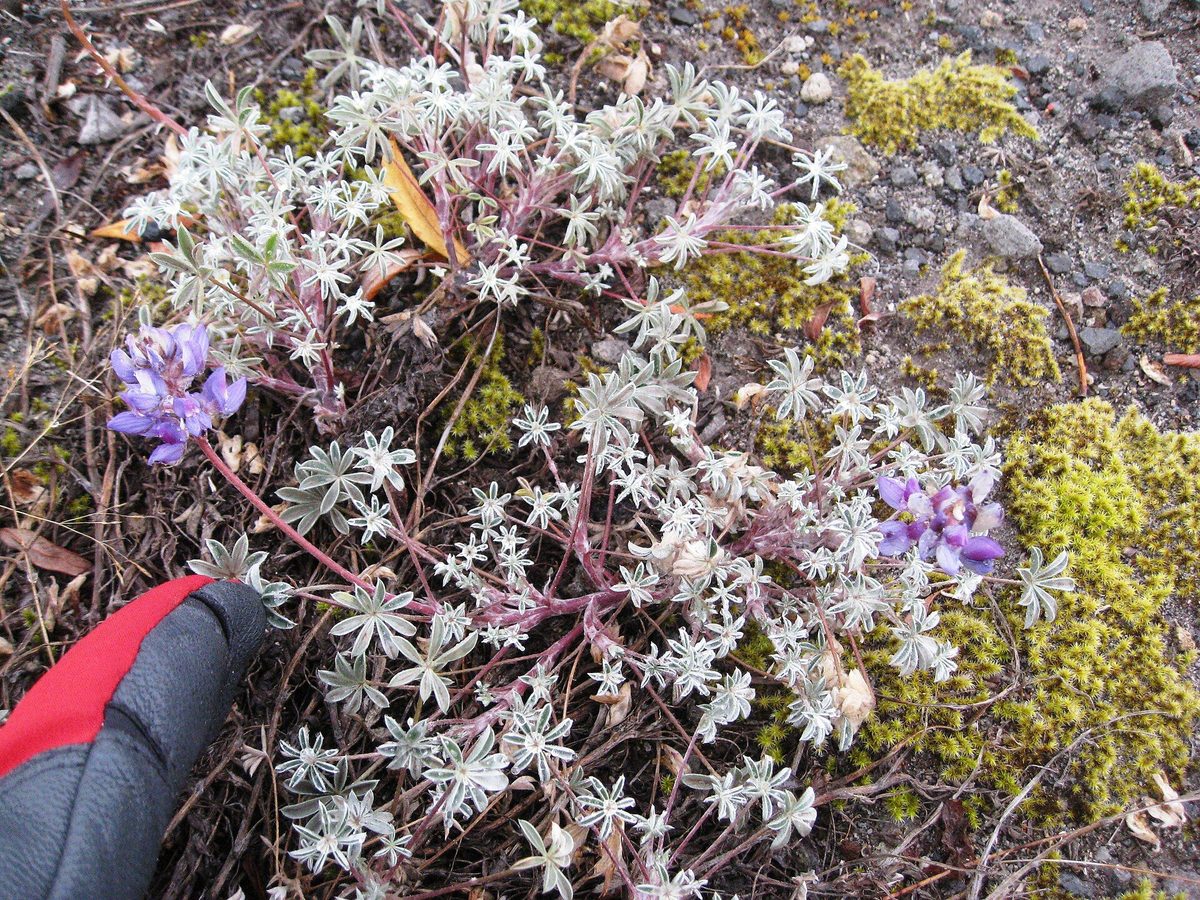
Photo: brewbooks, CC BY-SA 2.0
PART 3 · LEARN IT · 4 OF 4
It stays for the next plants
When a lupine dies and rots, its nitrogen stays in the ground. The plants that come next can use it.
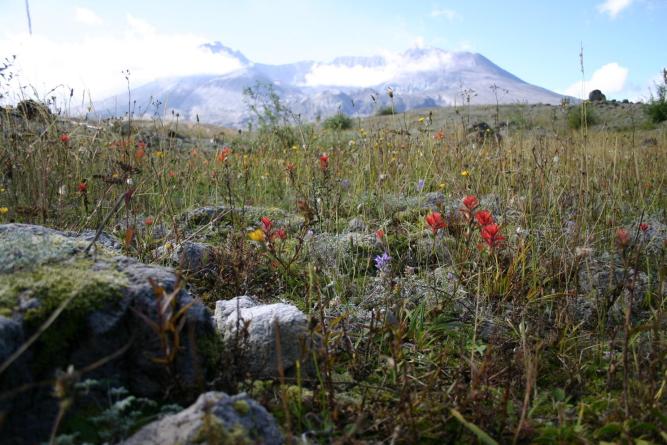
Photo: P. Frenzen, U.S. Forest Service
PART 3 · QUESTION 13
What did 1980 leave behind?
Primary succession
Nothing was left. No soil, no roots, no seeds.
Secondary succession
The plants were gone. Soil, roots or seeds were still there.
Plants mostly survived
Most plants were hurt, not killed.
Read the note under the site names for each site. Tick one box in each row. Then give evidence for one row. Say what was left, or use a number from Question 12.
The note changes when you pick a different site.
Screenshot: mrsajdak.com/succession, Tab 3
PART 3 · QUESTIONS 14 AND 15
A pioneer, and a prediction
QUESTION 14
Name the pioneer
Pick Studebaker Ridge. Look at Most common plants in the plots from 1984 to 1994. Write the plant at the top.
Use nitrogen fixation to explain why it is a good pioneer.
QUESTION 15
Predict 2040
Use Predict 2040 in the lab. Will cover be higher, lower or about the same as in 2009? What moves in next?
Use the pattern in the graph as your reason.
Photo: brewbooks, CC BY-SA 2.0
WRAP IT UP · QUESTION 16
Does a forest always grow back the same way?
The claim
“When a forest is destroyed, it always grows back the same way, at the same speed.”
From Part 2
Pick a number from your Question 6 table. Two communities with the same disturbance work well.
From Part 3
Pick a number from your Question 12 table. Two sites on the same volcano work well.
Reasoning
Say what was different about the places. Think about what was left behind.
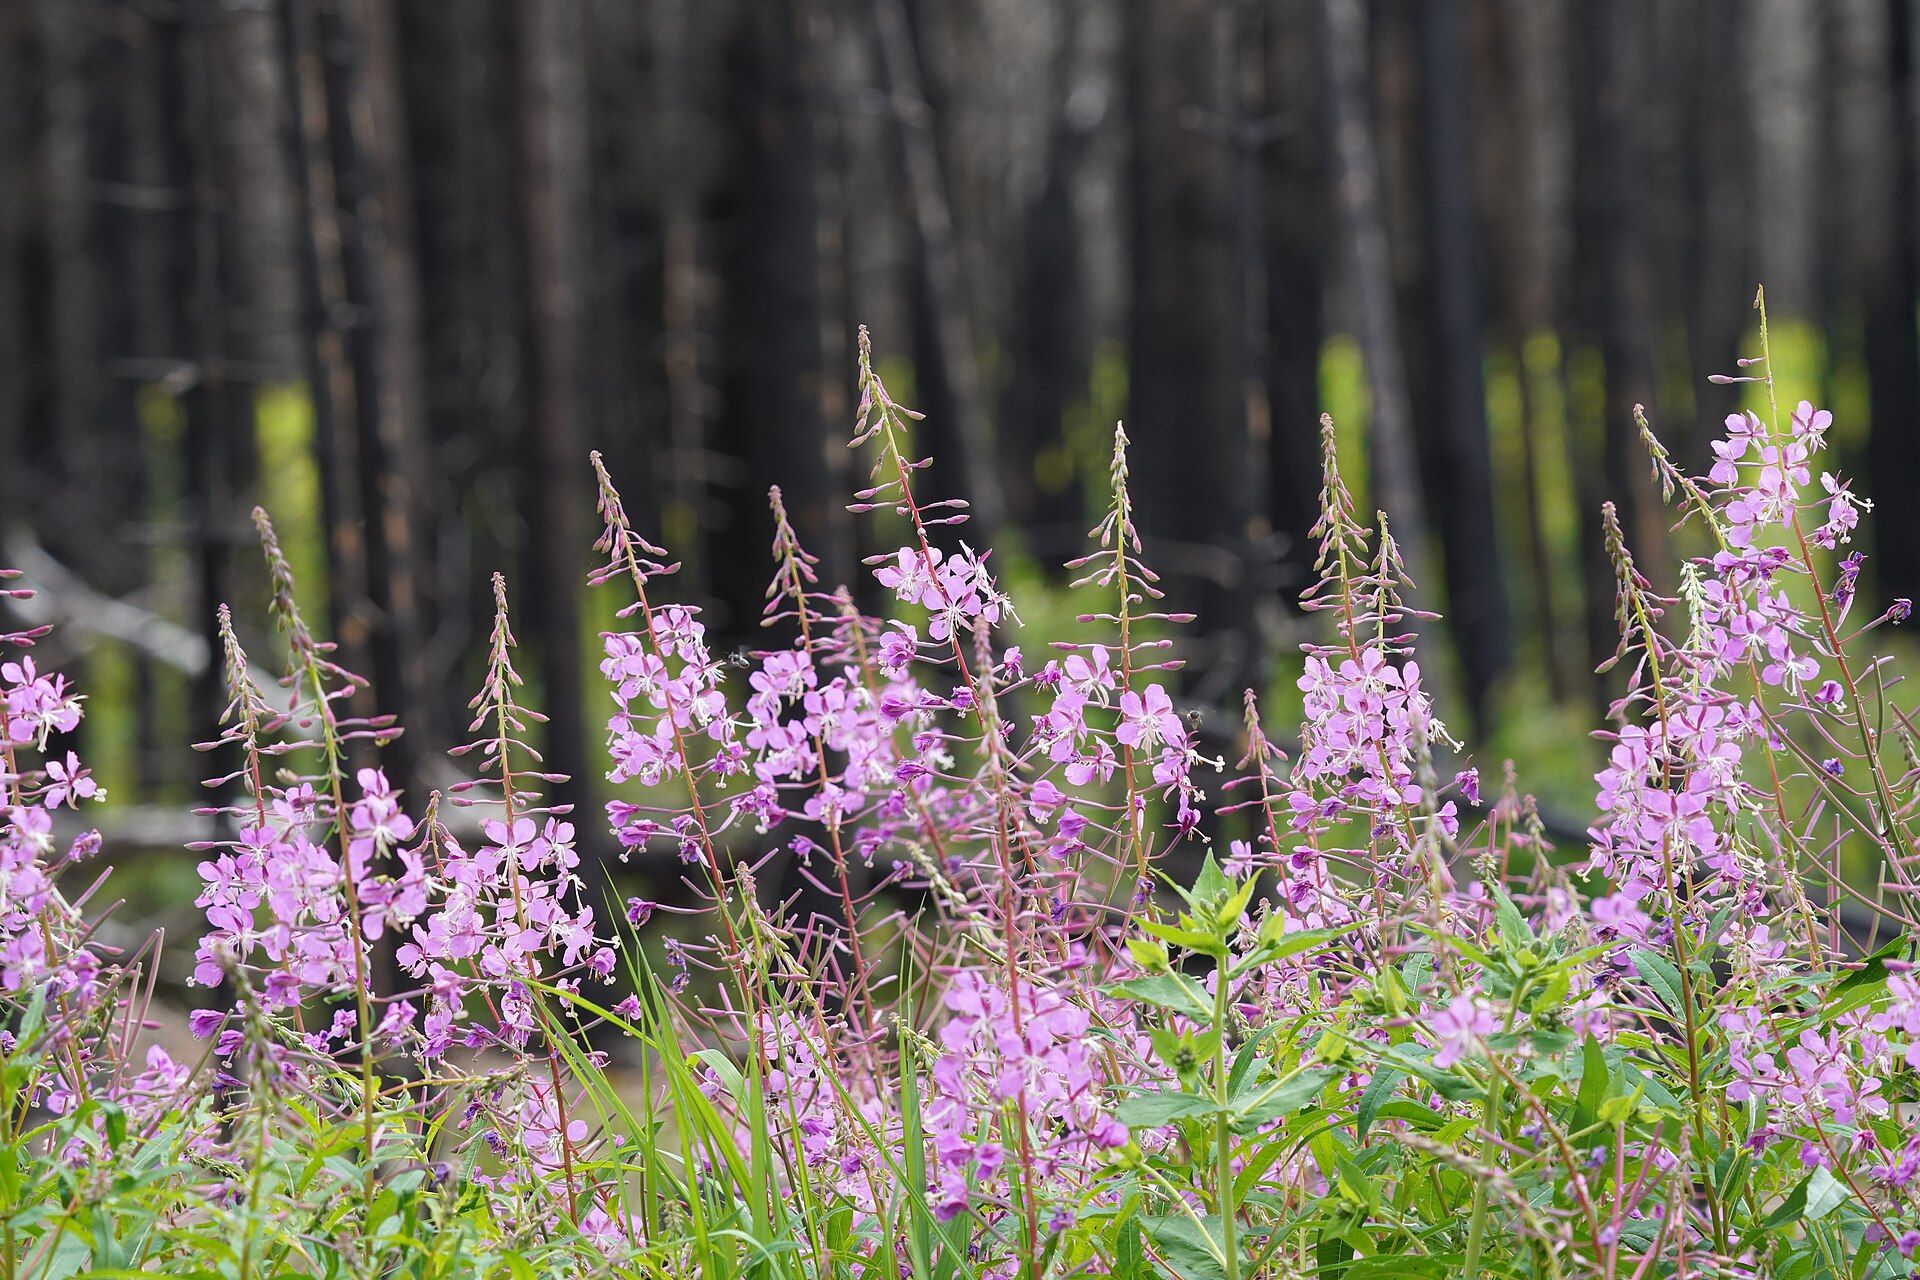
Wildflowers below Mount St. Helens in 2004, 24 years after the eruption.
Photo: P. Frenzen, U.S. Forest Service
WRAP IT UP · BACK TO THE START
Revisiting the Phenomenon
How do ecosystems recover after a disturbance, and why do some recover faster than others?
1Using evidence from today's investigation, explain how vegetation returned to Mount St. Helens following the eruption.
2Why did some locations recover faster than others?
3How do primary and secondary succession help explain the different recovery patterns?
4What evidence from the Mount St. Helens data supports your explanation?
LAST CHECK
Before you hand it in
Name, date and period are on top.
All four tables are full.
Question 13 has one tick in each row.
Every claim uses numbers from your own tables.
Photo: USDA Forest Service, Pacific Northwest Research Station