ENVIRONMENTAL SCIENCE · CHAPTER 6
Same Sun, Different Climates
Follow along with your worksheet, one question at a time.
mrsajdak.com/sunangle
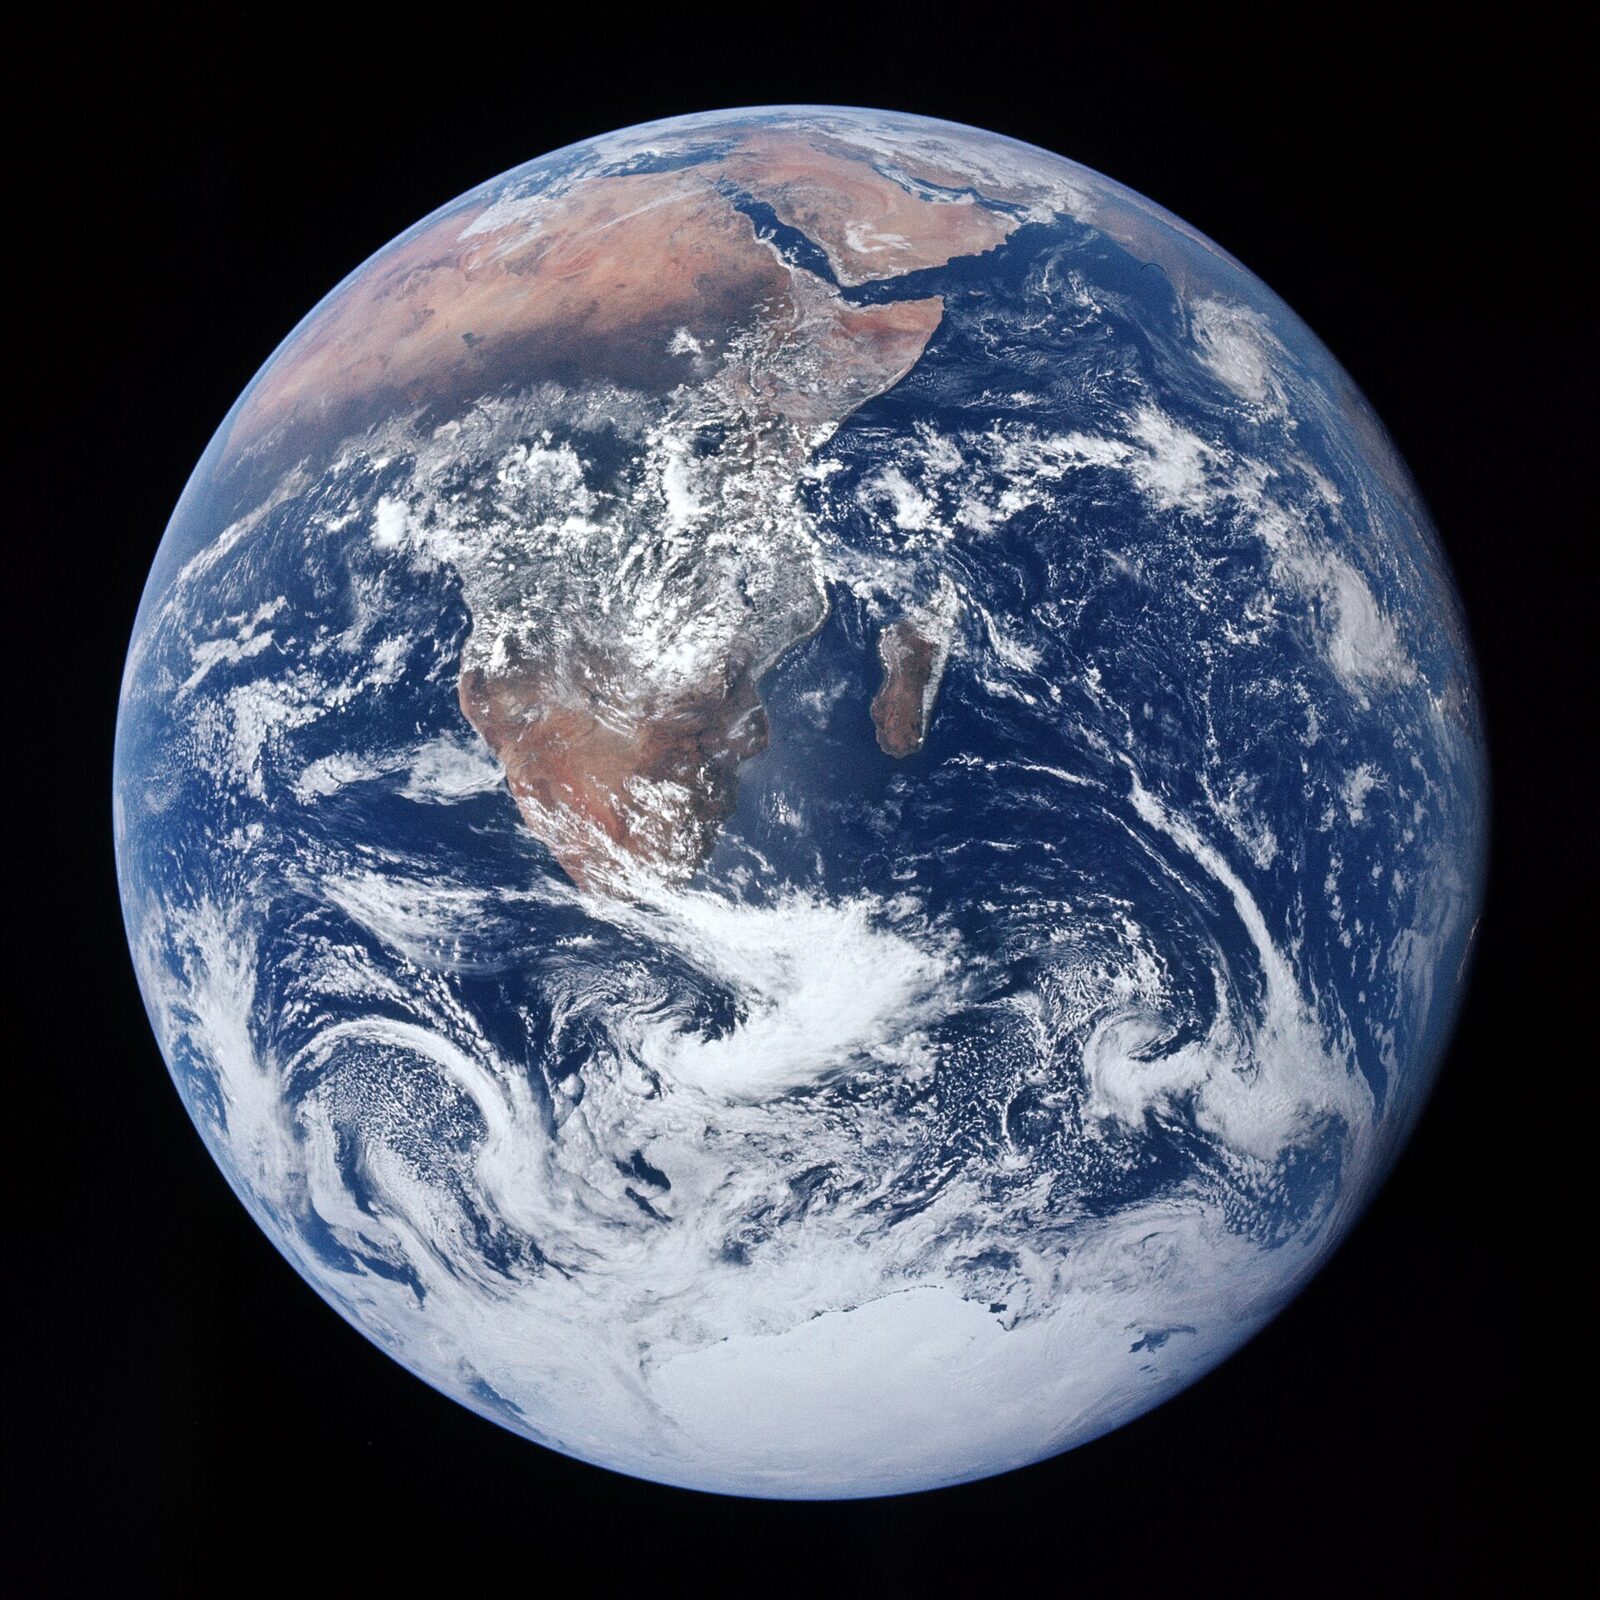
Photo: NASA, Apollo 17 crew, public domain
START HERE · PICK AN OPENER
Choose how to open the lesson
Click a card to jump to it. Every option ends at the same Observe, Wonder, Predict slide and the same driving question.
OPTION A · VIDEO
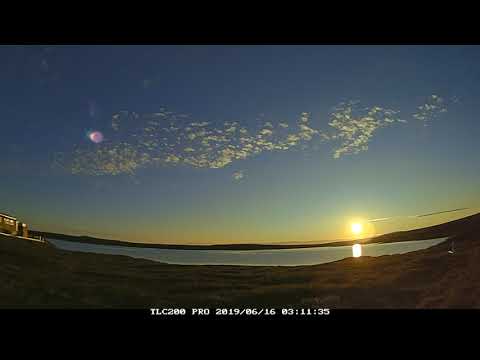
The Midnight Sun
Clip 1 is one June night in northern Alaska, sped up. Clip 2 is a sculpture in Honolulu, Hawaii, at noon in May. Clip 3 is one town in Norway on two days of the year.
Watch for
How high does the sun get in Alaska? Does it ever set?
In Honolulu, watch the shadow under the sculpture.
Same sun. What is different about where it is in the sky?
Videos on YouTube: PolarTREC; Custom Island Tours; atomsmurf.
OPTION B · TRY IT · 3 MINUTES
Light on a Ball
1
Dim the room. Hold a ball at the front: a globe, a basketball or any light-colored ball.
2
From about 2 meters away, shine one phone flashlight straight at the middle of the ball.
3
Look at the light in the middle of the ball. Then look near the top.
4
Tip the top of the ball a little away from the light. Watch the top again.
You need
A ball, light-colored if you have one
One phone flashlight
The room lights off or down
Watch for
Where is the ball brightest?
Where is the light dim and stretched out?
What happens to the top when it tips away?
OPTION C · PHOTOS
Phenomenon: Two Beaches, One Sun
Photos: Mike Peel (mikepeel.net), CC BY-SA 4.0 · Andrei, CC BY 2.0
START HERE
Observe, wonder, predict
The same sun shines on the whole Earth. Near the equator the sea is warm enough to swim in all year. In the far north the sea is full of ice. How can the same sun make places so different?
OBSERVEWhat did you notice about the sunlight in each place?
WONDERWhat do you wonder about the sunlight at each beach?
PREDICTWhich place gets more energy from the sun: near the equator or the far north? Explain your reasoning.

Photo A, up close.
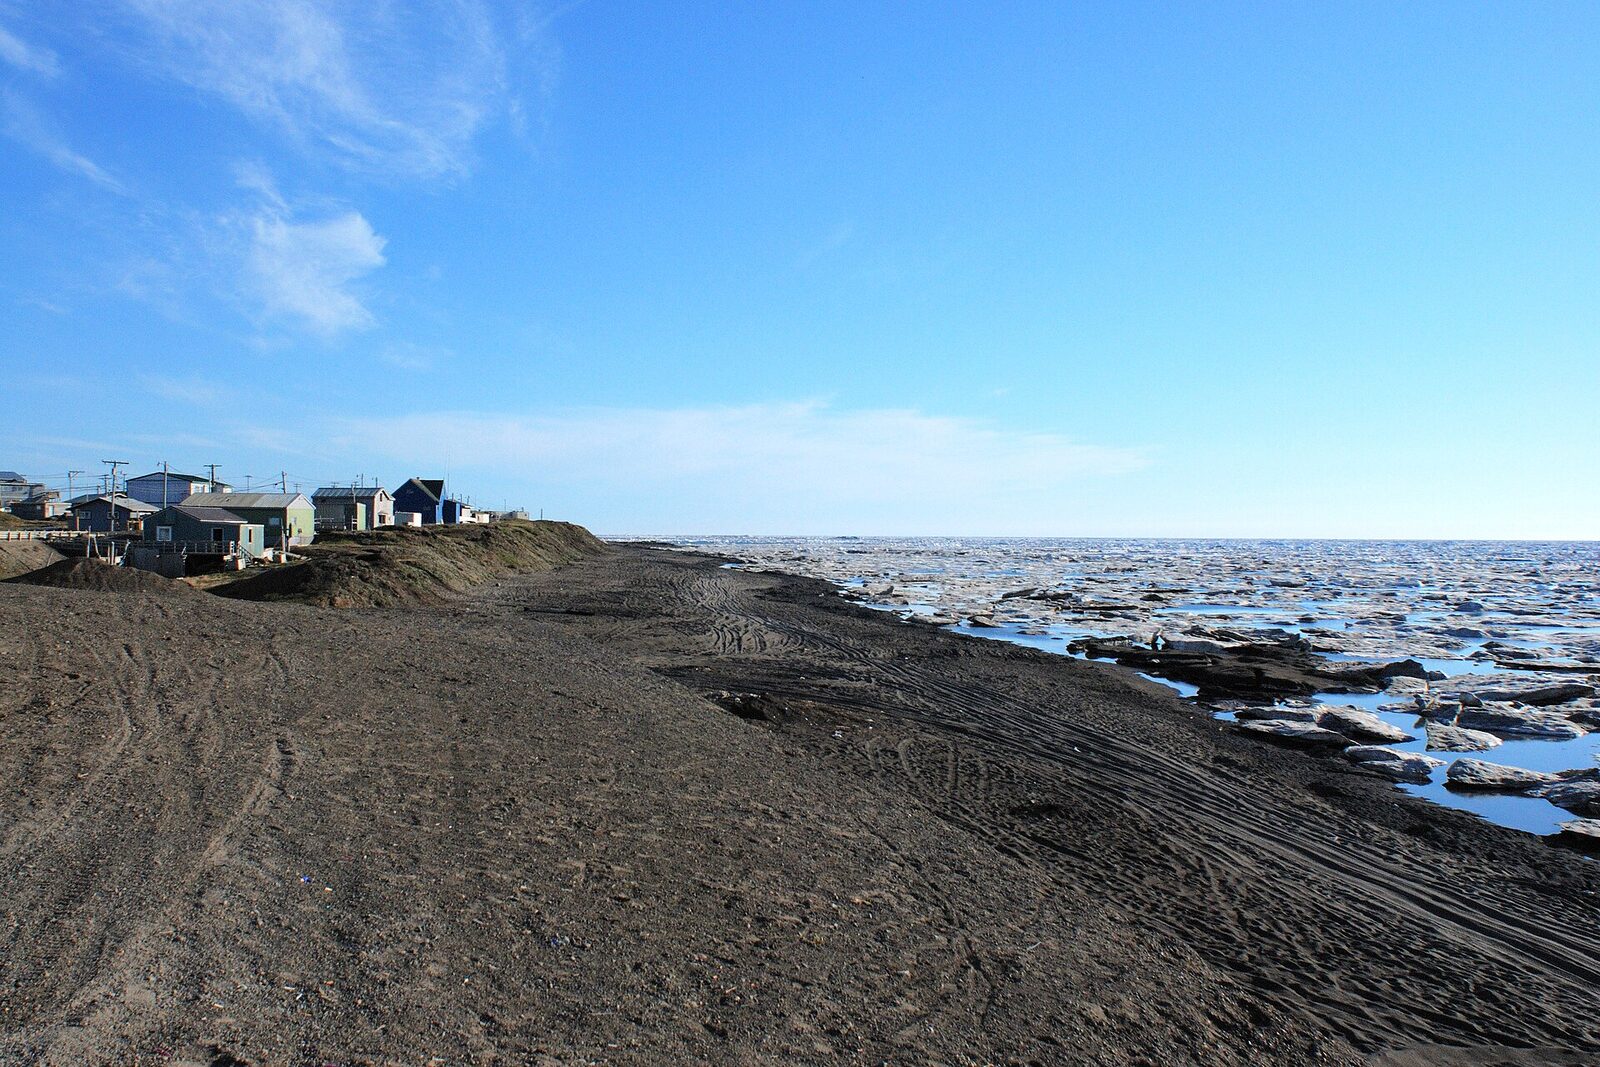
Photo B, up close.
Photos: Mike Peel (mikepeel.net), CC BY-SA 4.0 · Andrei, CC BY 2.0
DRIVING QUESTION
Why does the same sun make such different climates?
START HERE
Where Are These Beaches?
Finished observing? Click here to find out.
Photo A is East Coast Park in Singapore, a city almost on the equator. It is warm there every month of the year. Photo B is Utqiagvik, Alaska, the farthest-north town in the United States. It is below freezing there about eight months of the year, and the sea near it is frozen for much of the year. Both photos were taken on clear days under the same sun.
Watched the video or tried it? Click here.
The video shows Toolik Lake in northern Alaska, about 68° N, on a June night: the sun never sets, but it never gets high either. In Honolulu at noon in May, the sun is straight overhead. The ball shows the same light on a round surface: bright in the middle, dim near the top.
Today, you will shine a light at different angles and count the squares it covers. You will follow sunlight to a round, tilted Earth. Then you will use real temperatures from five cities, from Singapore to Utqiagvik. At the end, you will return to the driving question.
BEFORE YOU START
One sun, many places
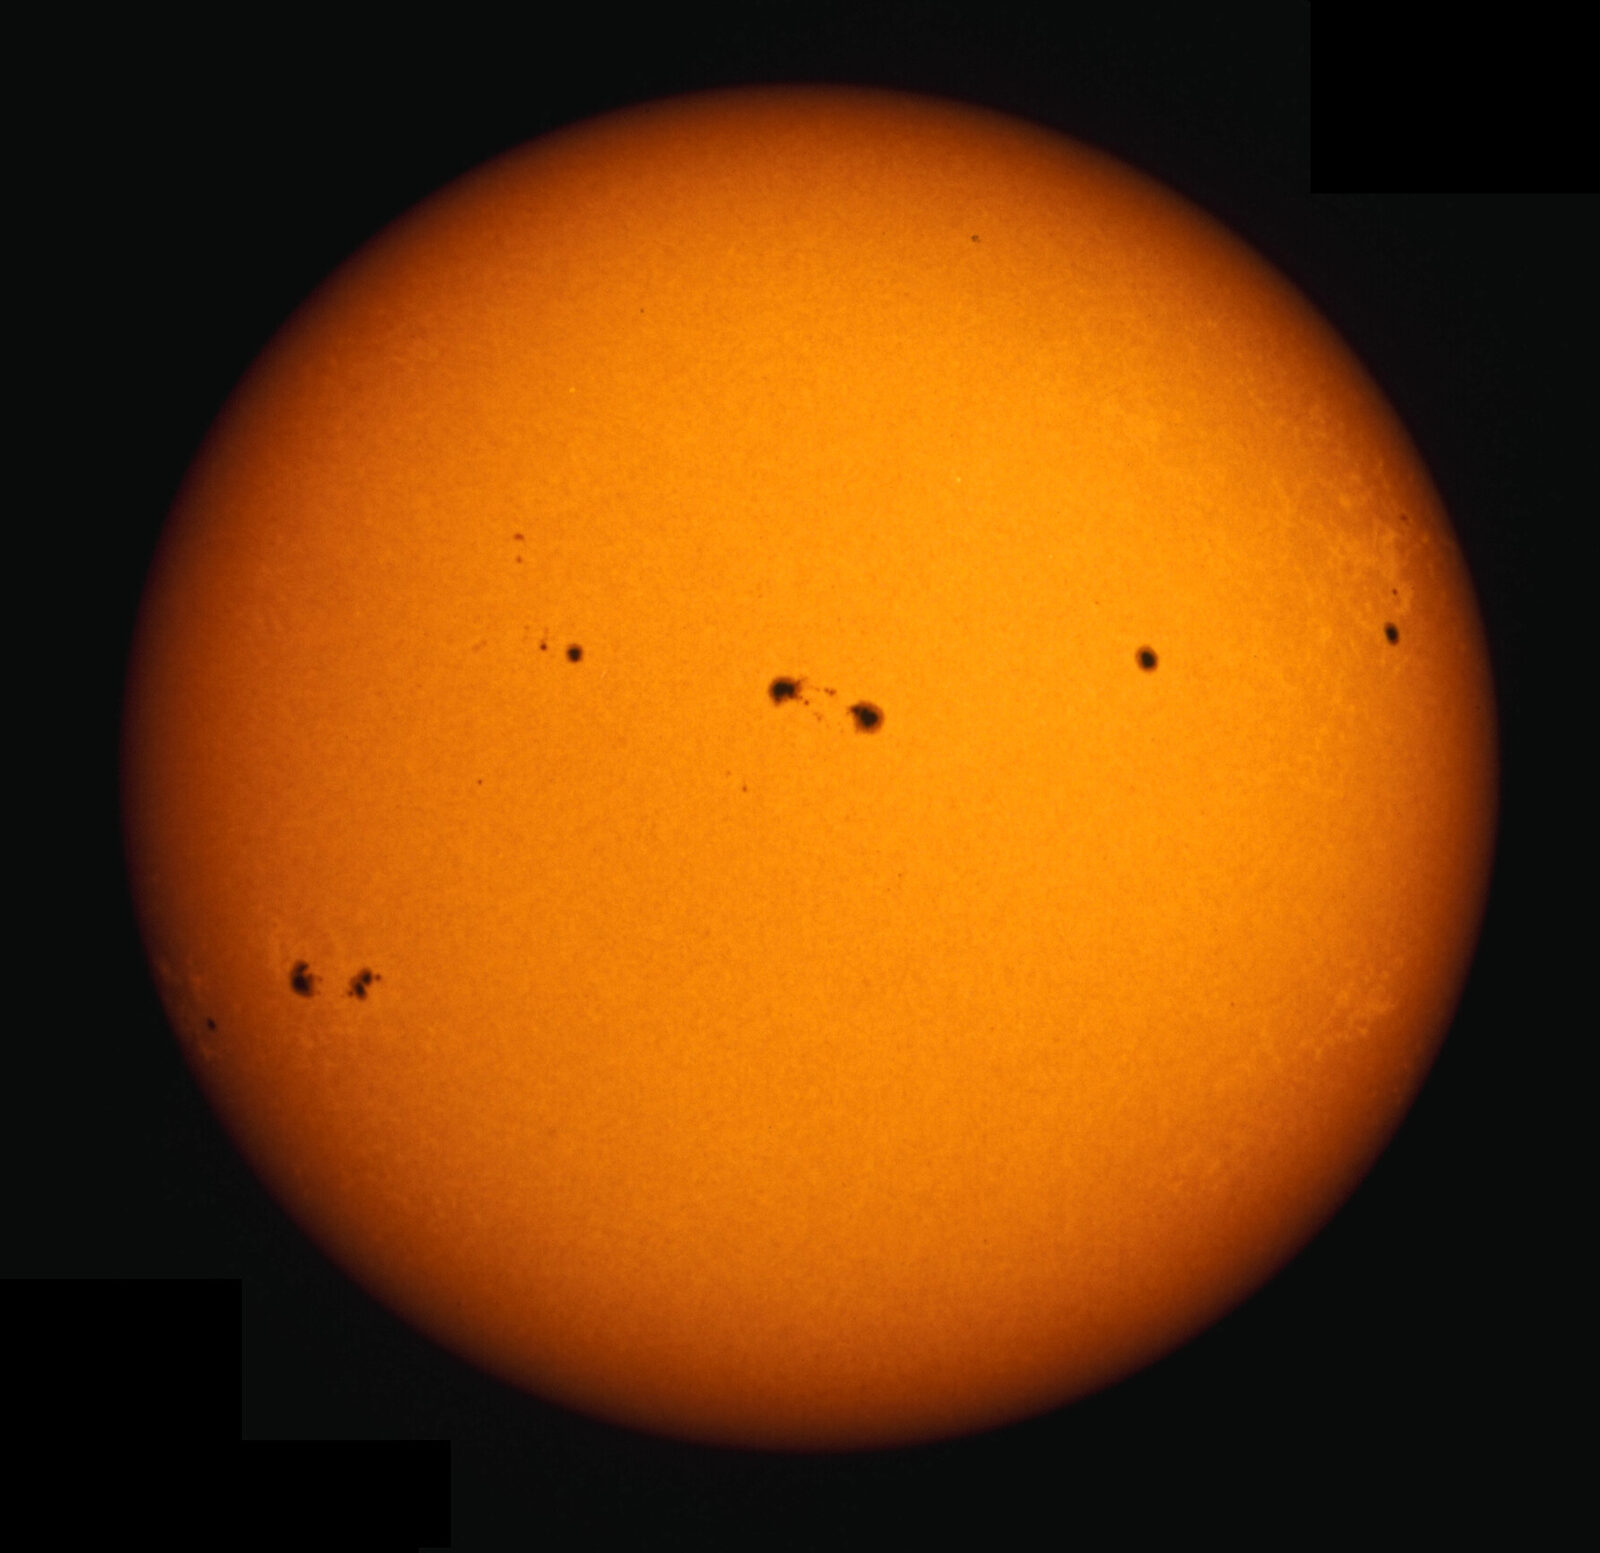
The sun is about 150 million km away. Its light takes about 8 minutes to reach us.
Words for this lab
The angle of light is how slanted it is. 90° is straight down.
The equator is the line around the middle of Earth. The poles are the top and bottom.
W/m² means watts per square meter. It measures how much sunlight lands on each square meter.
°F is degrees Fahrenheit. Water freezes at 32°F.
Is the equator hot because it is closer to the sun?
Photo: NSO/AURA/NSF, CC BY 4.0
BEFORE YOU START
What you will learn
I can measure how the angle of light changes the area it covers.
I can explain why the equator is warm and the poles are cold.
I can tell weather from climate and use data to predict a city's climate.
BEFORE YOU START
Get set up
1
Open mrsajdak.com/sunangle on your device.
2
Write your name, the date and your period on the worksheet.
3
Find the three tabs at the top of the lab. Each tab goes with one part of the worksheet.
4
Start on Tab 1. Do not skip ahead.

| Tab in the lab | Worksheet | Questions |
|---|---|---|
| 1. The flashlight test | Part 1 | 1 to 5 |
| 2. A tilted Earth | Part 2 | 6 to 11 |
| 3. Five cities | Part 3 and Wrap it up | 12 to 16 |
Screenshot: mrsajdak.com/sunangle
TAB 1 · QUESTIONS 1 TO 5
Part 1. The flashlight test
You will shine one light at a sheet of grid paper.
The light never changes. Only its angle does. Count how many squares it lights up.
Photo: Bonnie Moreland, public domain
PART 1 · TAB 1
Aim the light and count
1
Press 90°. Then press Trace and count.
2
Do the same at 45° and at 20°.
3
Pick one more angle of your own with the slider. Count it too.
4
Look at the spot each time. Is it bright, medium or dim?
PART 1 · QUESTION 1
Copy your readings
1
Find Your readings in the lab.
2
Copy Squares lit for each angle.
3
Copy Times as many. It is squares lit ÷ squares lit at 90°.
4
Copy Light on each square. The light has 100 units to share.
5
Write bright, medium or dim from the spot.
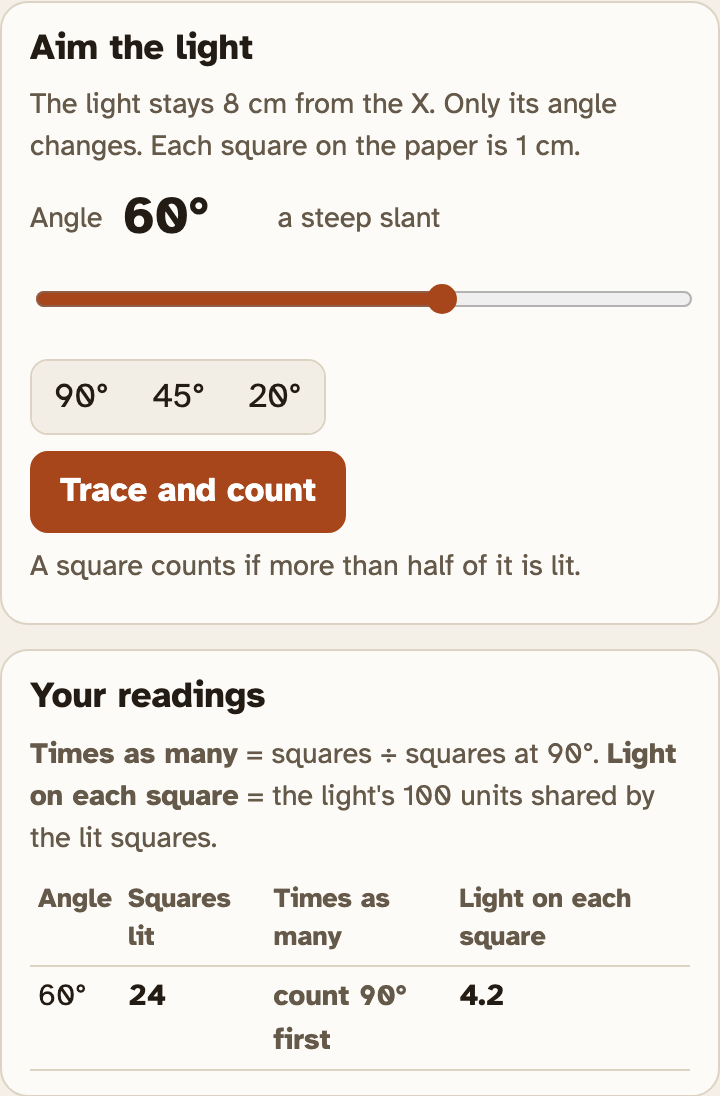
Example
A light lit 10 squares at 90°.
It lit 30 squares at a slant.
30 ÷ 10 = 3
These are not your numbers. Use your own.
The screenshot is 60°. That angle is not on the worksheet.
Screenshot: mrsajdak.com/sunangle, Tab 1
PART 1 · QUESTION 2
Was it a fair test?
QUESTION 2
Kept the same
Name two things that stayed the same each time you counted.
Hint: read the top of the Aim the light box.
QUESTION 2
Changed
Name the one thing you changed on purpose.
Screenshot: mrsajdak.com/sunangle, Tab 1
PART 1 · LEARN IT · 1 OF 4
Same light, more squares
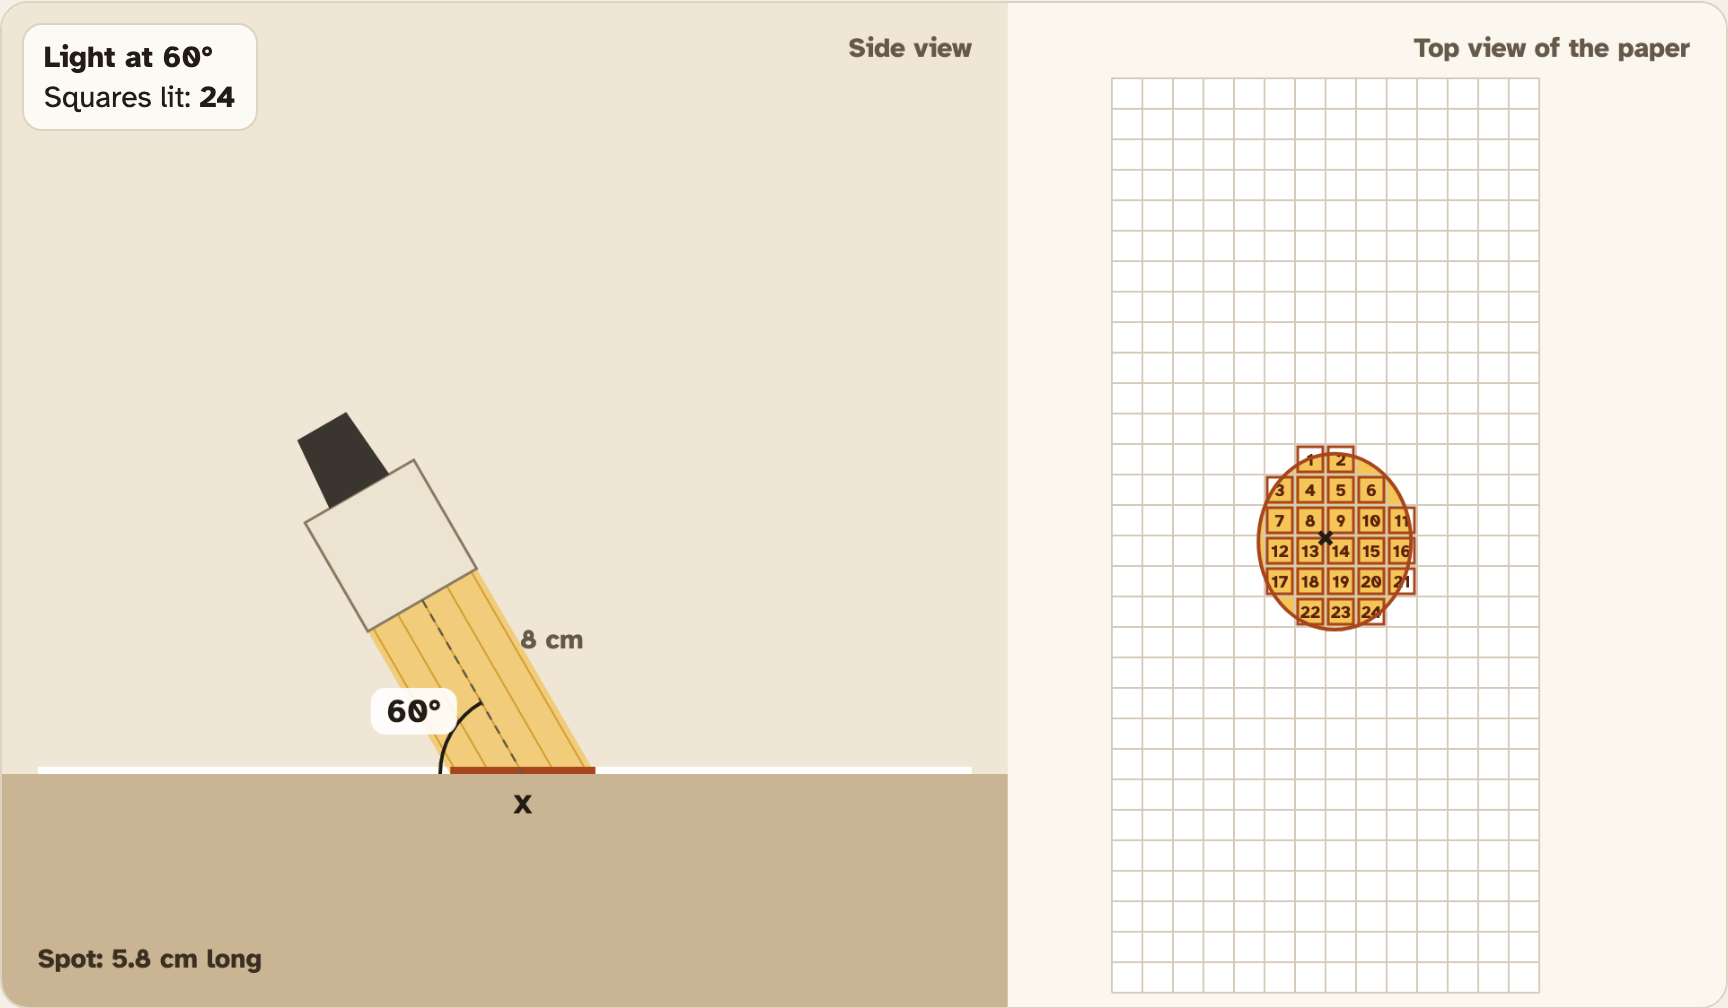
Your light never changed. Same light, same 8 cm. Only the angle changed. Straight down, the light landed on about 19 squares. At 20°, the same light covered about 58 squares. That is about 3 times as many.

Photo: Simonqq21, CC BY 4.0
PART 1 · LEARN IT · 2 OF 4
Spread out means weaker
The light has to be shared. When it covers 3 times as many squares, each square gets about one third as much. That is why the 20° spot looks dim. Scientists call this the energy per square meter: how much energy lands on each square meter of ground.
Photo: Bonnie Moreland, public domain
PART 1 · LEARN IT · 3 OF 4
The sun does the same thing
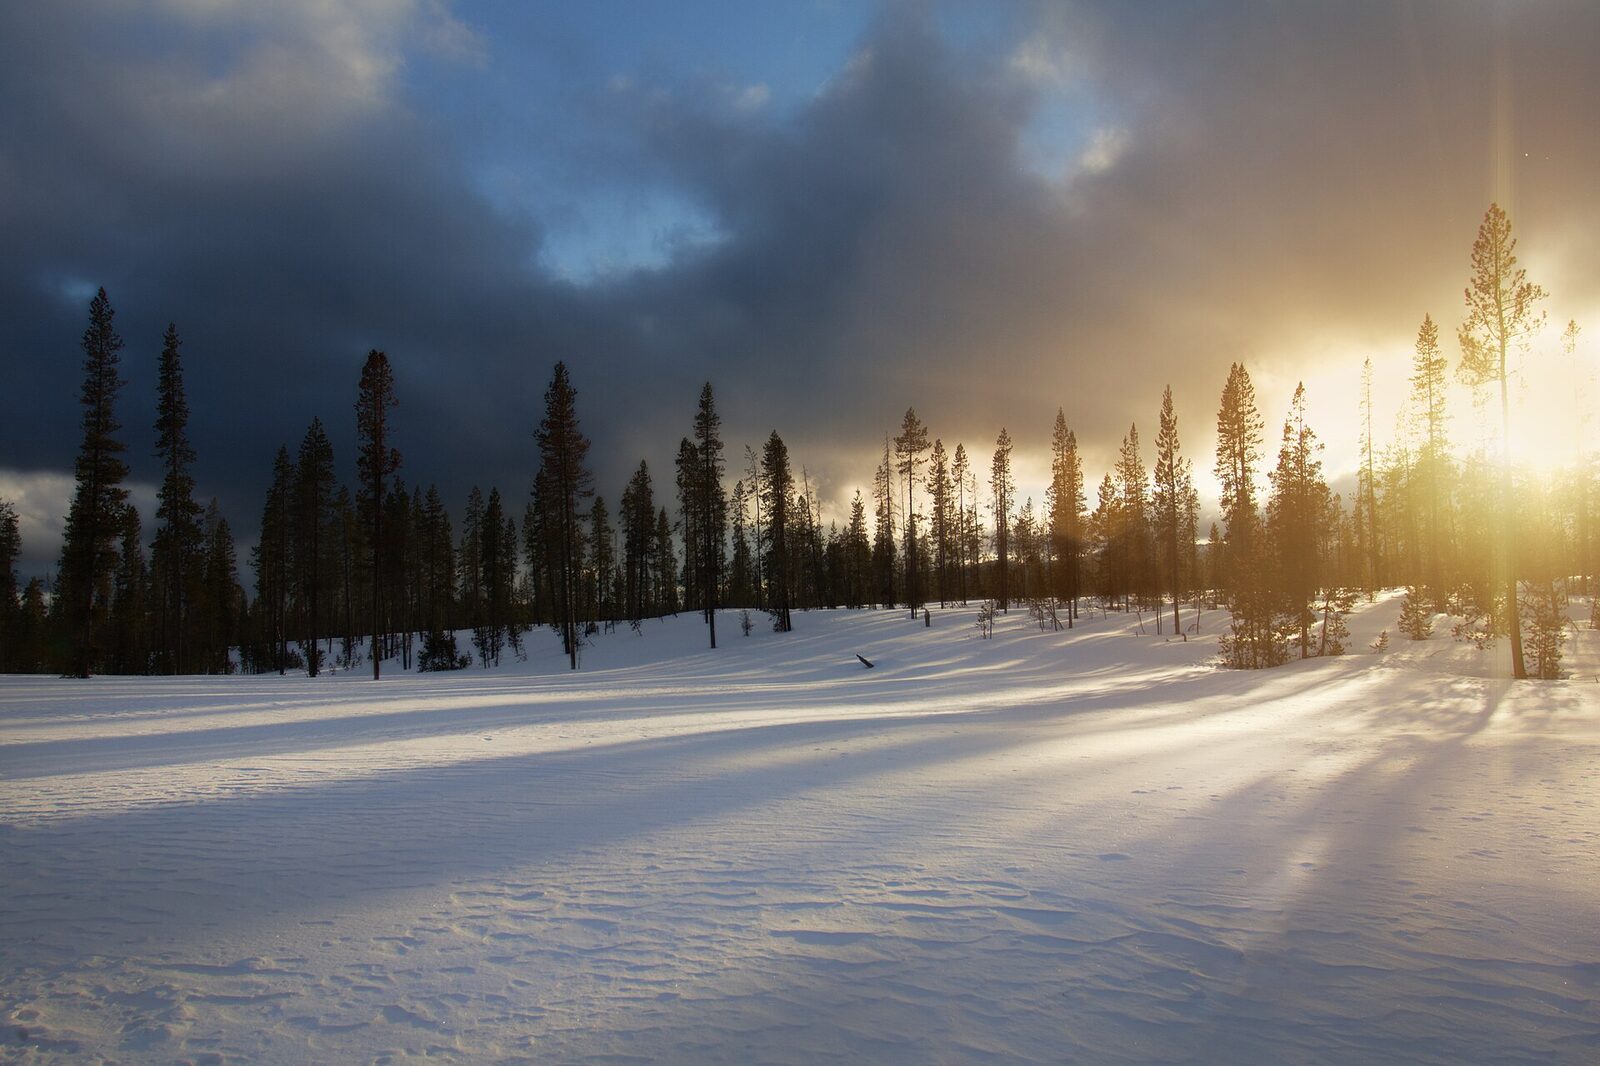
Sunlight comes in straight lines. When the sun is high in the sky, its light hits the ground almost straight on, like your 90° light. When the sun is low, its light hits at a slant, like your 20° light. Each square meter gets less energy and warms less.

Photo: BertholdD., CC BY-SA 3.0
PART 1 · LEARN IT · 4 OF 4
A low sun also crosses more air
Slanted sunlight takes a longer path through the air. The air soaks up and scatters some of it on the way. So a low sun loses even more energy before it reaches the ground. That is why you can look at the setting sun.
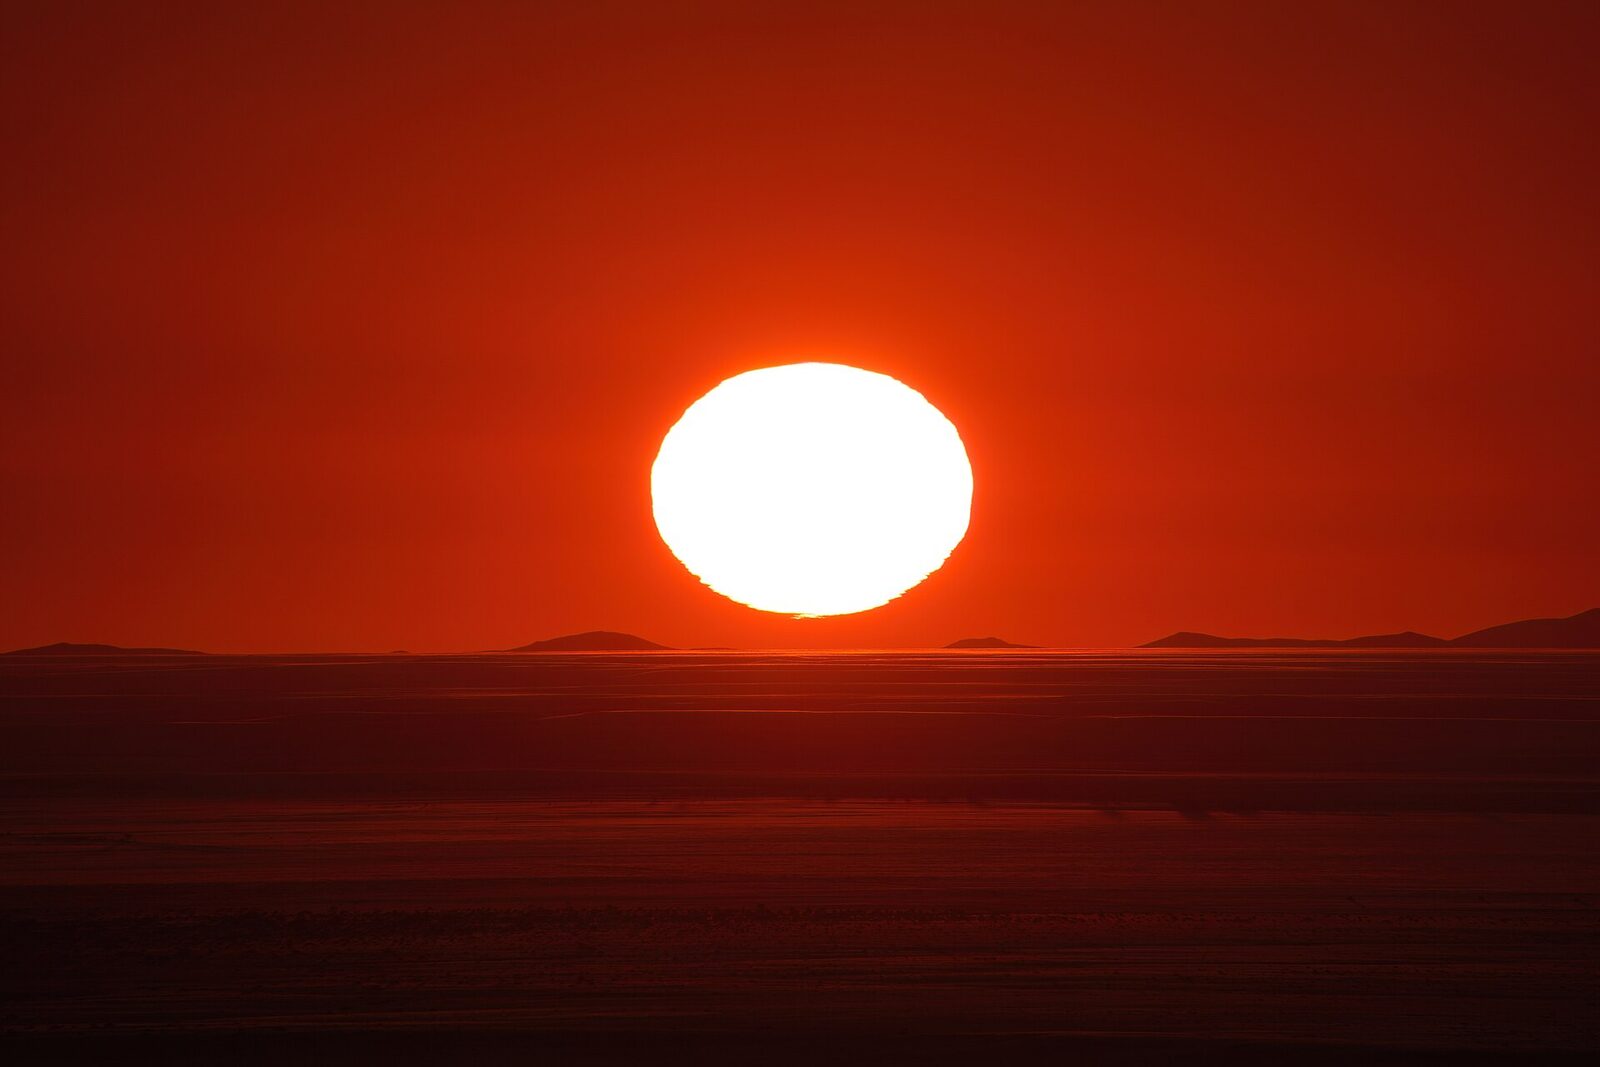
Photo: Giles Laurent, CC BY-SA 4.0
PART 1 · QUESTIONS 3 AND 4
Explain what you saw
QUESTION 3
20°
Why is it dim?
At 20°, each square got about what fraction of the light at 90°?
Use the words energy per square meter to explain the dim spot.
QUESTION 4
90° · 20°
Equator and poles
Which of your lights is like the noon sun near the equator?
Which is like the noon sun near the poles?
Give a squares number for each.
PART 1 · QUESTION 5
Predict, then check 10°
1
Look at the graph under the drawing. Follow the dots as the angle gets smaller.
2
Predict the squares lit at 10°. Write it down first.
3
Now slide the angle to 10°. Press Trace and count.
4
Write the real count. What happens to the light on each square?

TAB 2 · QUESTIONS 6 TO 11
Part 2. A tilted Earth
Now the light is the sun. The paper is the ground.
You will follow sunlight to Buffalo in winter and in summer. Is it the distance to the sun, or the angle?
Photo: NASA, public domain
PART 2 · TAB 2
Record Buffalo and three places
1
Pick Buffalo. Pick Jan and press Record.
2
Pick Jul and press Record.
3
Pick Mar. Record Singapore, Buffalo and Utqiagvik.
4
Copy from Your records.
PART 2 · QUESTIONS 6 AND 7
Read your records
| Distance from the sun | How far Earth is from the sun that day, in millions of km. |
| Sunlight reaching Earth | Sunlight at the top of the air, facing the sun. Only distance changes it. |
| Noon sun height | How high the sun is at noon. 90° is straight up. |
| Sunlight on each m² | Sunlight on flat ground at noon. Distance and angle both change it. |
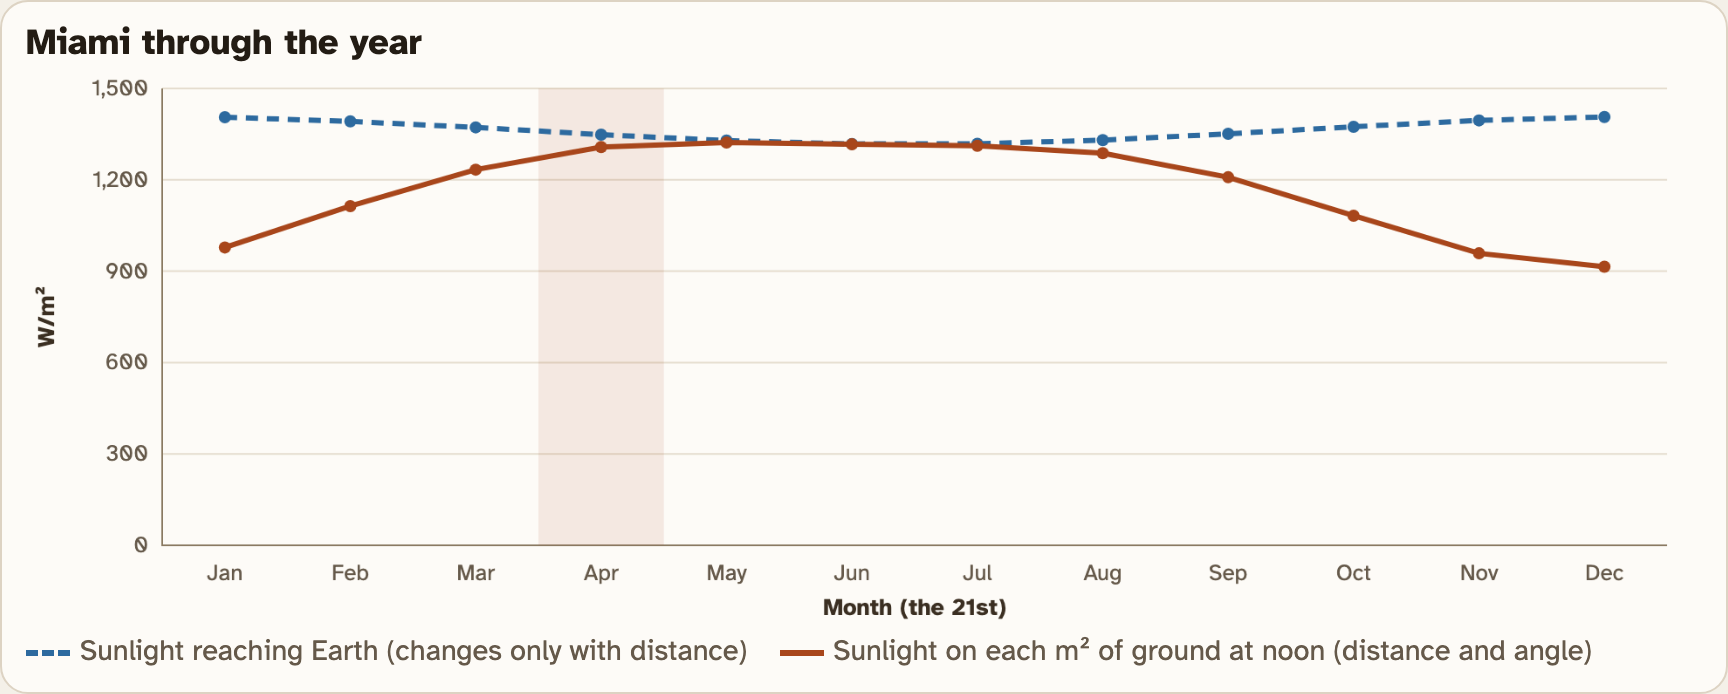
Dashed blue: sunlight reaching Earth. It barely changes all year.
Solid orange: sunlight on each m² of ground. It changes a lot.
This graph is Miami. It is not on the worksheet.
Screenshot: mrsajdak.com/sunangle, Tab 2
PART 2 · LEARN IT · 1 OF 5
Latitude
Latitude is how far a place is from the equator, in degrees north or south. The equator is 0°. The North Pole is 90° N. Buffalo is about 43° N.
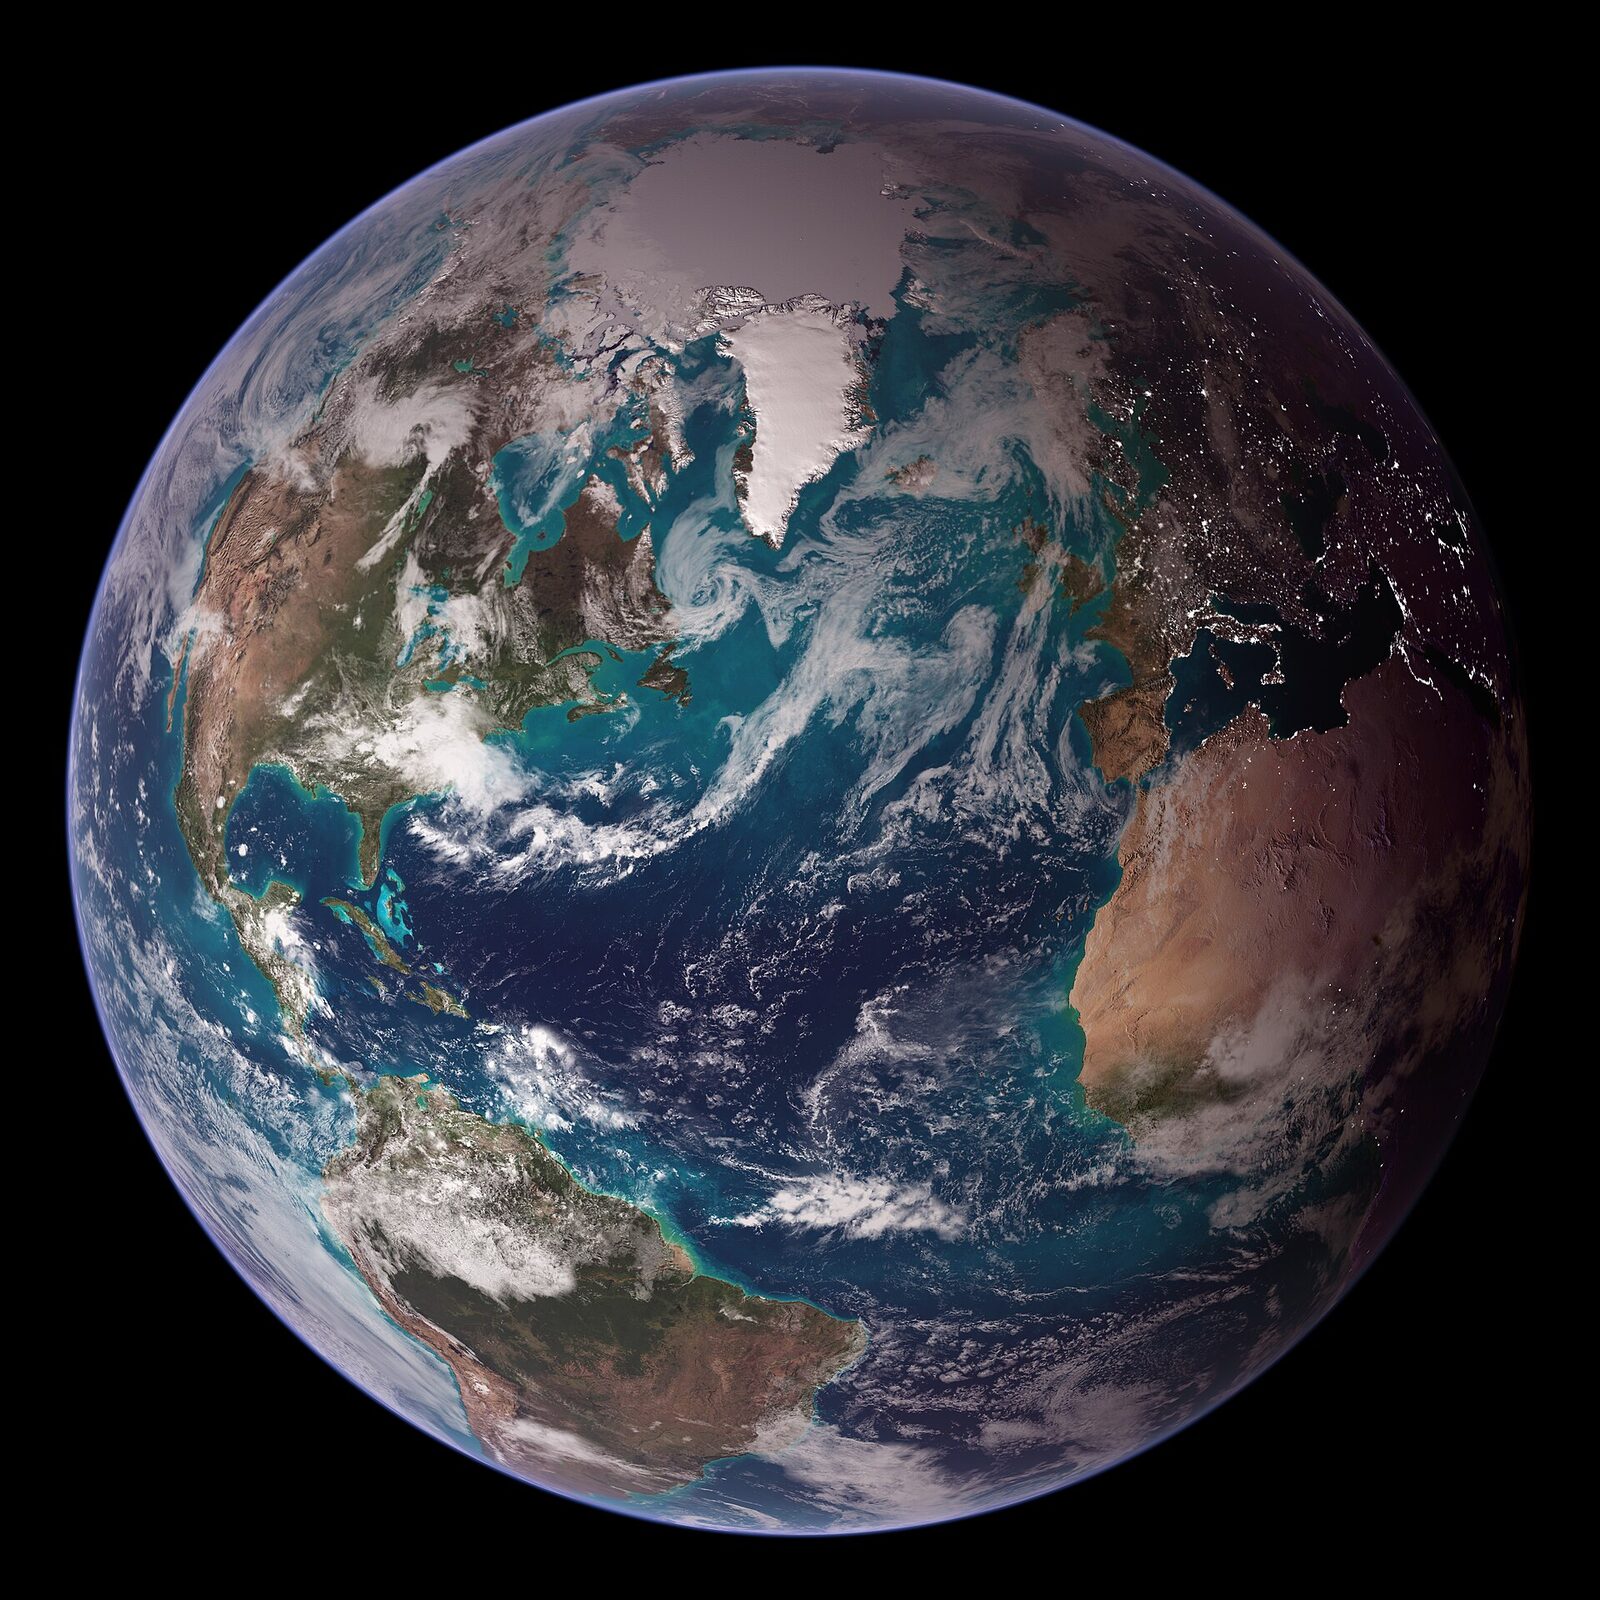
Photo: NASA, Reto Stöckli, public domain
PART 2 · LEARN IT · 2 OF 5
A round Earth
Earth is a ball. Near the equator, the noon sun is high and sunlight hits almost straight on. Farther north or south, the ground curves away from the sun. Sunlight hits at a lower angle and spreads out. Places near the equator get the most energy per square meter.
Photo: NASA, Apollo 17 crew, public domain
PART 2 · LEARN IT · 3 OF 5
The tilt makes seasons
Earth’s axis is tilted about 23.5°. It always points the same way in space. In June, the north half of Earth leans toward the sun. The noon sun is high in Buffalo and the days are long. In December, it leans away. When it is summer in the north, it is winter in the south.
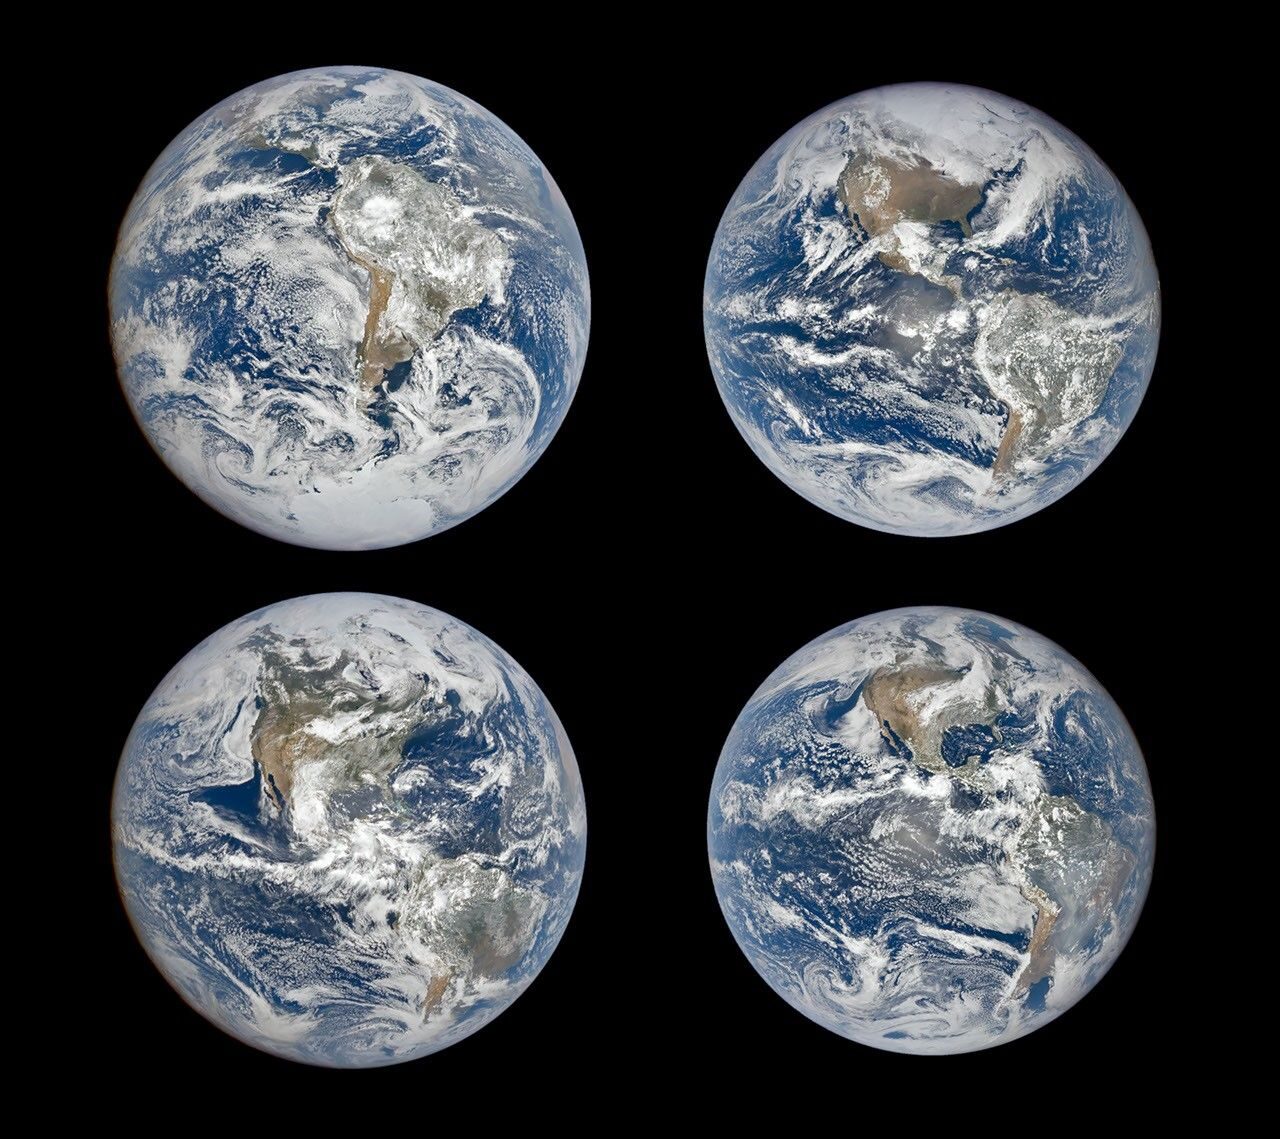
Photo: NASA Earth Observatory, DSCOVR EPIC, public domain
PART 2 · LEARN IT · 4 OF 5
Distance is not the reason
Earth is closest to the sun in early January, about 147 million km away. It is farthest in early July, about 152 million km away. So Buffalo is coldest when Earth is closest! Distance changes the sunlight reaching Earth by only about 7%. In Buffalo, the angle changes it by about 2 times.
Photo: NSO/AURA/NSF, CC BY 4.0
PART 2 · LEARN IT · 5 OF 5
Wind and water move the heat
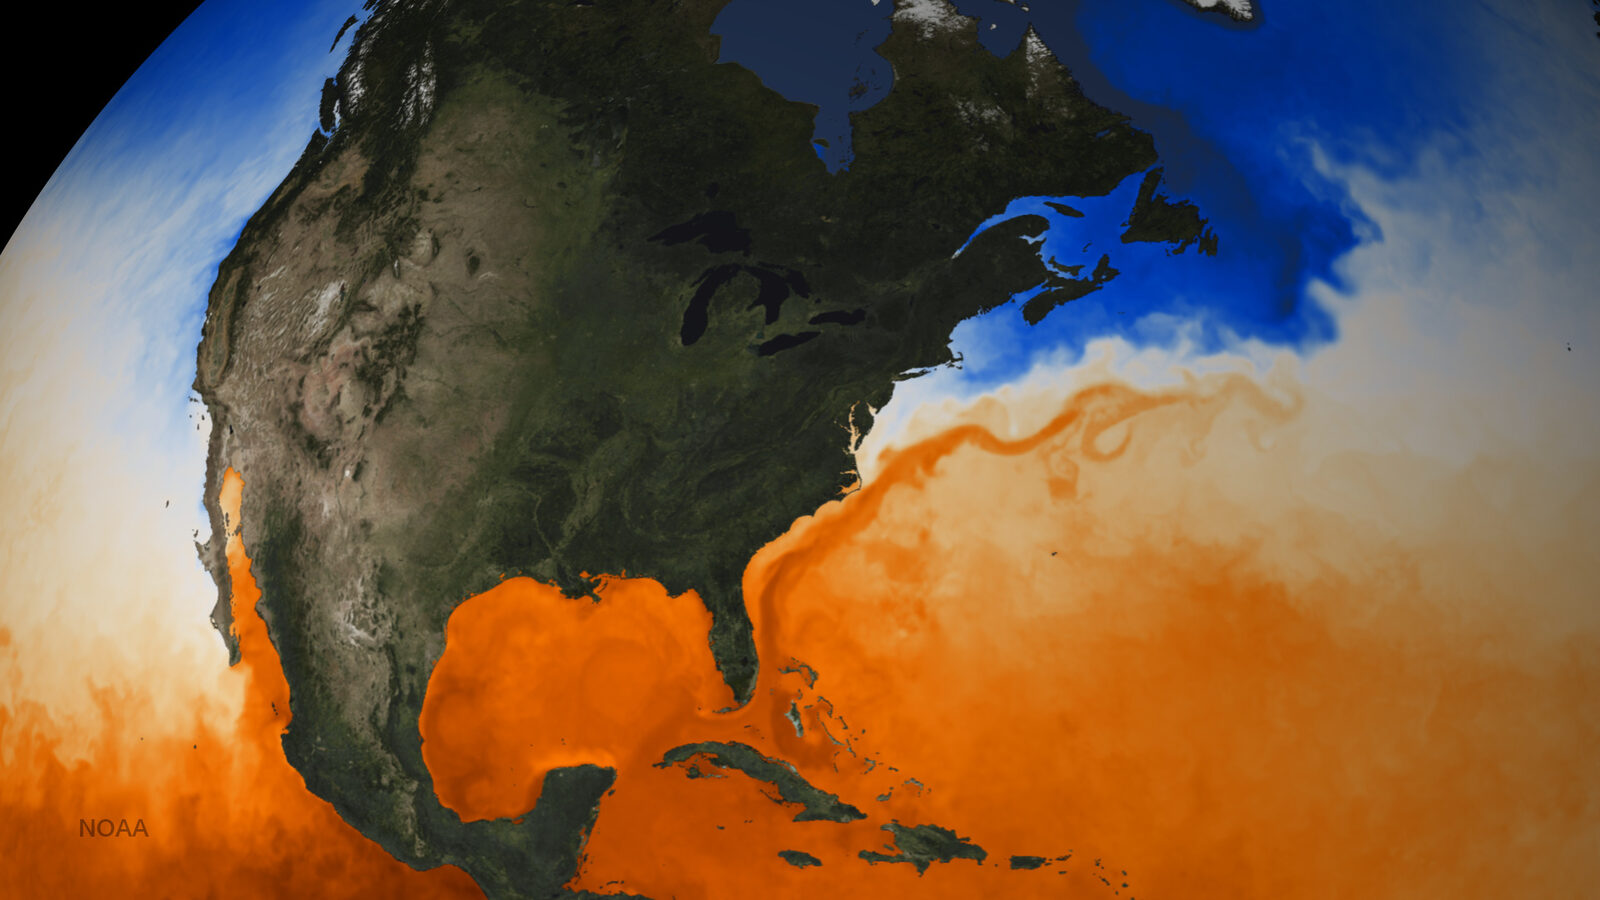
The equator gets more energy than the poles. Wind and ocean currents carry some of that heat from the equator toward the poles. You will learn more about them later in Chapter 6.
Map: NOAA, public domain
PART 2 · QUESTIONS 8 AND 9
Angle or distance?
QUESTION 8
Latitude ↑
Use Question 7
As latitude goes up, what happens to the noon sun? To the sunlight on each m²?
Explain why, using the shape of Earth.
QUESTION 9
Jul ÷ Jan
Use Question 6
Divide July by January for sunlight reaching Earth. That change is from distance.
Divide again for sunlight on each m². That change is mostly from angle.
Which changes Buffalo’s sunlight more?
PART 2 · QUESTION 10
Farther from the sun in winter?
The claim
“Buffalo is cold in winter because Earth is farther from the sun then.”
Your job
Argue for or against it.
Evidence
Use two numbers from your Question 6 table. A distance number works well. So does a sunlight number.
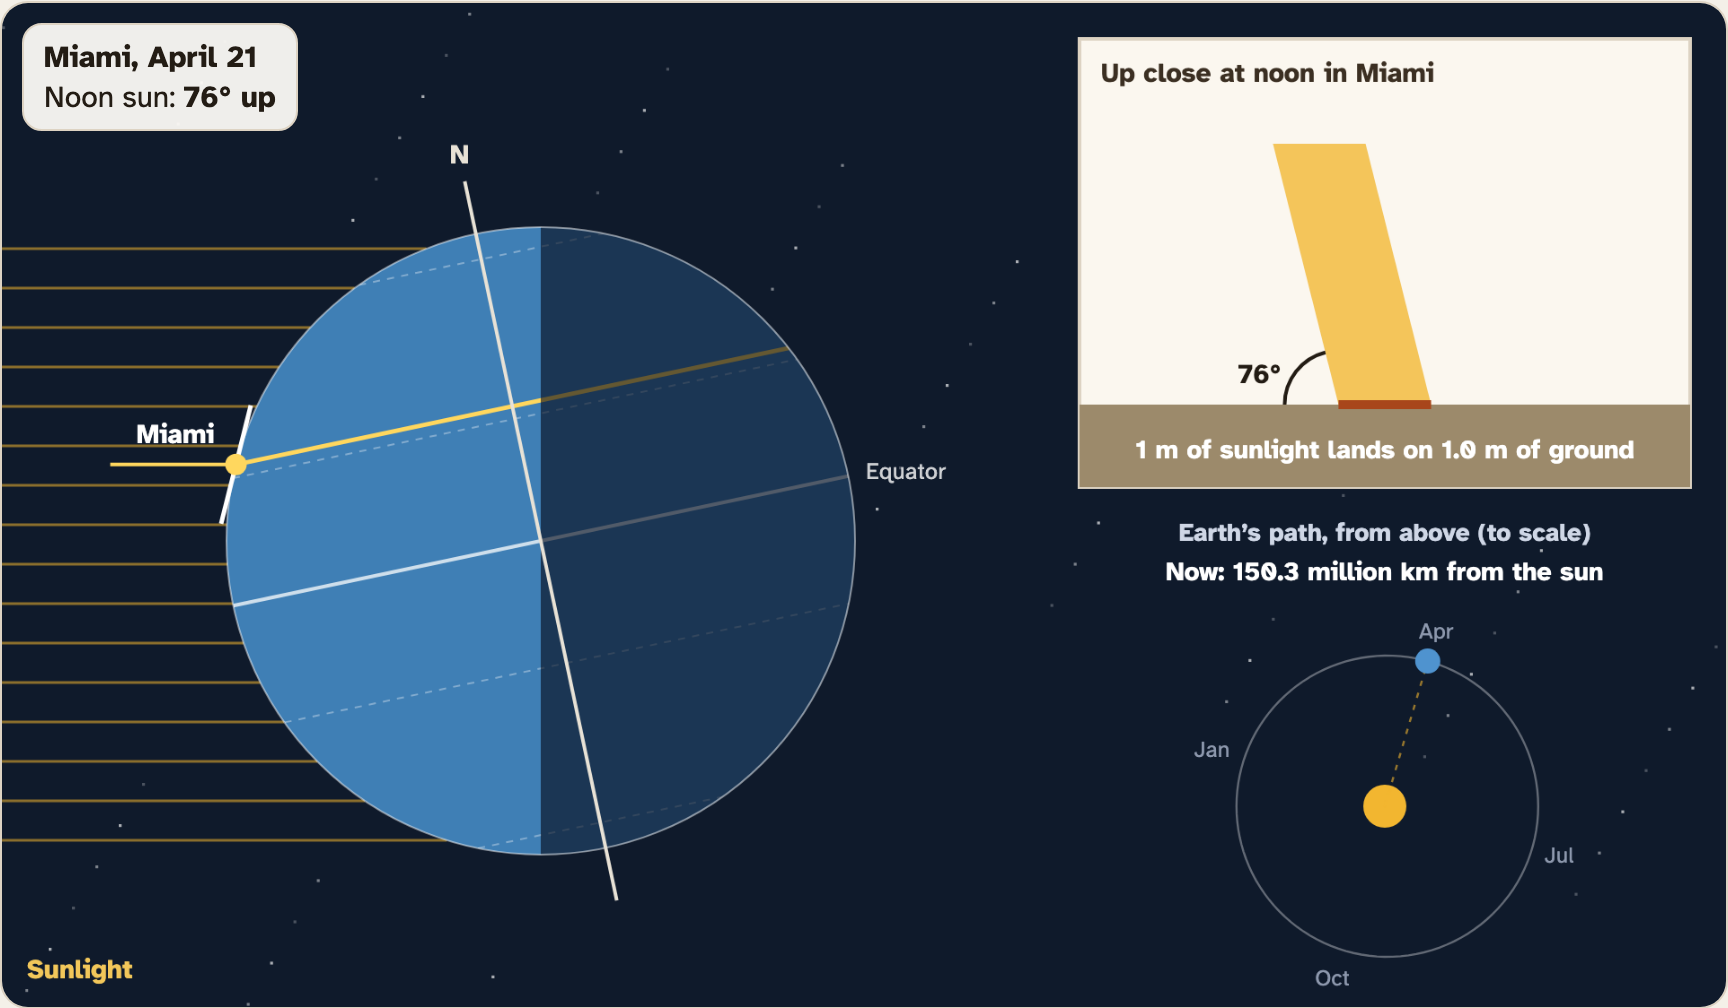
Screenshot: mrsajdak.com/sunangle, Tab 2, Miami in April
PART 2 · QUESTION 11
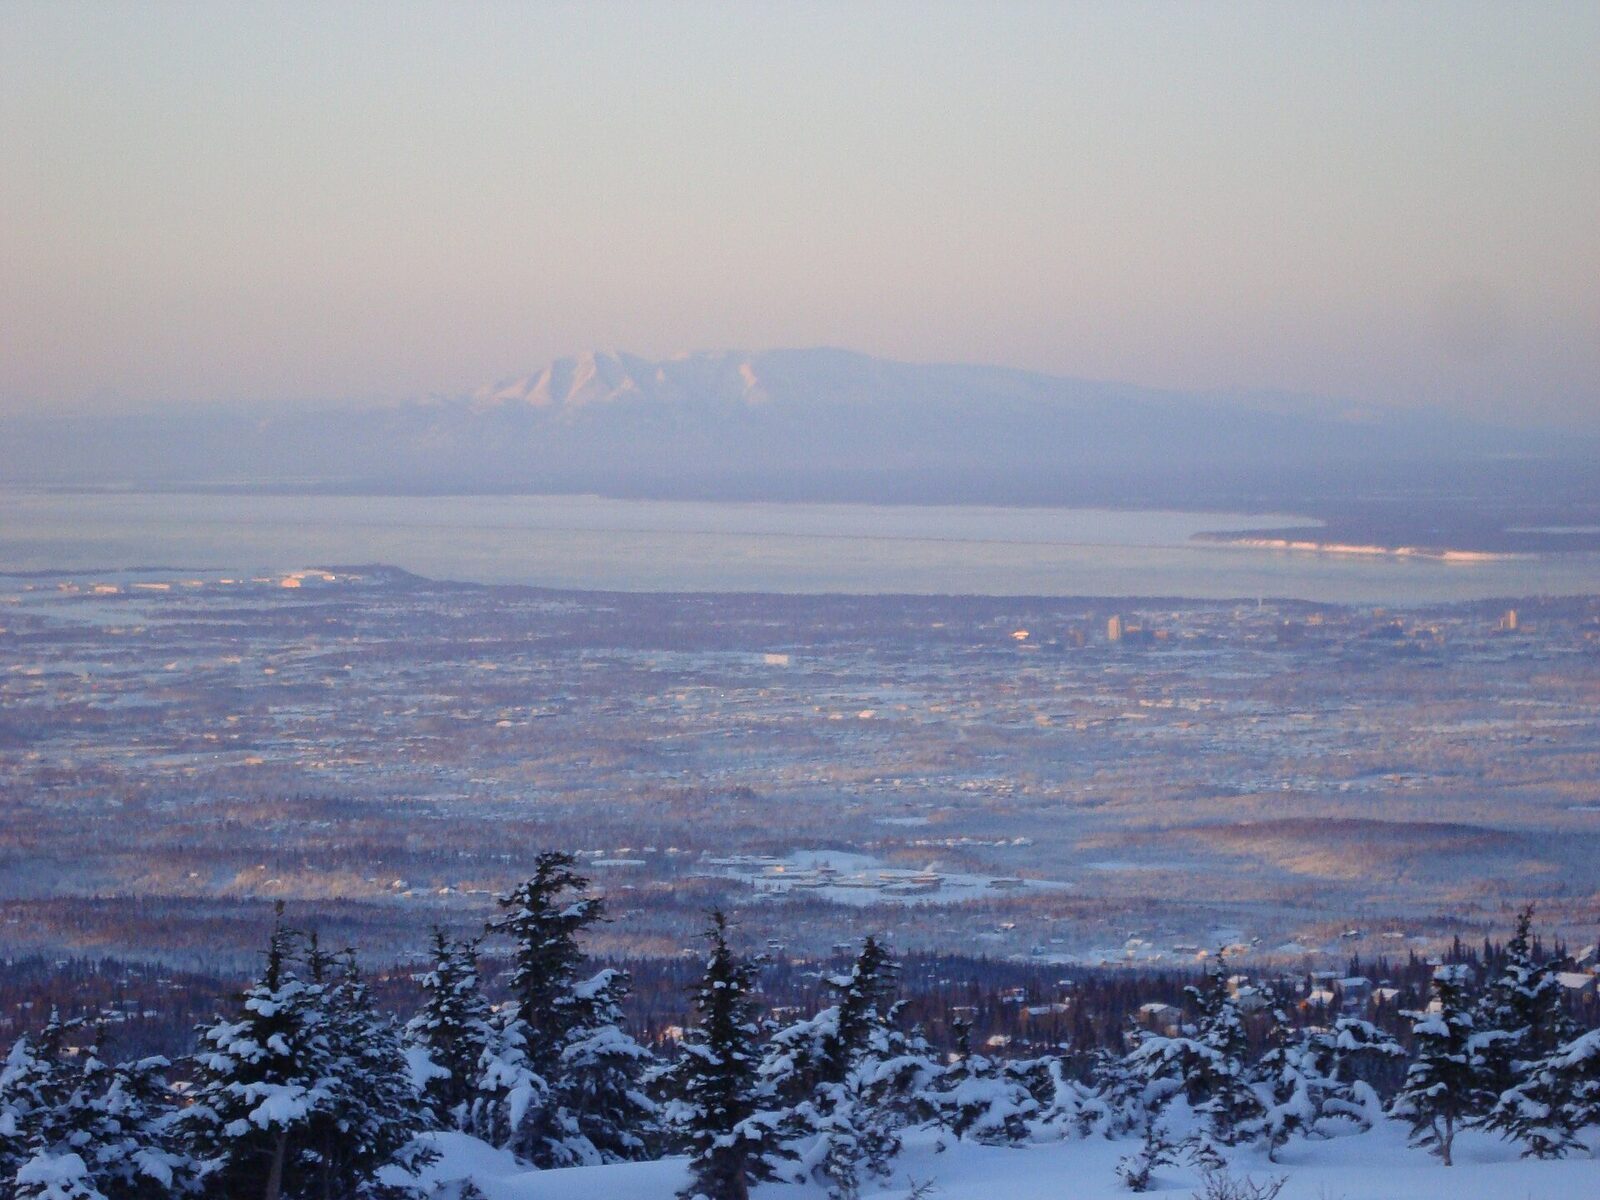
Utqiagvik in winter and summer
1
Pick Utqiagvik.
2
Pick Dec. Read the noon sun height.
3
Pick Jun. Read the noon sun height.
4
Use Earth’s tilt to explain the difference.
TAB 3 · QUESTIONS 12 TO 16
Part 3. Five cities
Now for real thermometers.
You will plot 30 years of real temperatures from five cities. Then you will look at one year of Buffalo’s weather, day by day.
Photo: Zaereth, public domain
PART 3 · TAB 3
Plot the five cities
1
Pick a city. Press Plot this city.
2
Do all five: Singapore, Miami, Buffalo, Anchorage, Utqiagvik.
3
Copy from Your cities: the noon sun in March, the year average and the gap.
PART 3 · QUESTION 12
What is the gap?
The gap is the warmest month minus the coldest month.
A small gap means the place is about the same all year. A big gap means hot summers and cold winters.
Example
Warmest month: 80°F. Coldest month: 50°F.
80 − 50 = 30
These are not your numbers. Use your own.
50
J
52
F
57
M
63
A
69
M
75
J
79
J
80
A
75
S
67
O
59
N
52
D
A made-up city. Each bar is one month. The warmest bar minus the coldest bar is the gap.
PART 3 · QUESTION 13
One year of weather in Buffalo
1
Find One year of weather in Buffalo.
2
Move the slider to March 19. Copy that day’s average and the normal.
3
Do the same for January 22.
4
Read the whole year of 2025 and Buffalo’s normal year under the slider.
5
Press Show 2025 on the graph.
PART 3 · LEARN IT · 1 OF 5
Weather
Weather is what the air is doing right now, today or this week: the temperature, rain, snow and wind. It changes by the hour and by the day. In Buffalo in 2025, some days were more than 20°F away from normal.
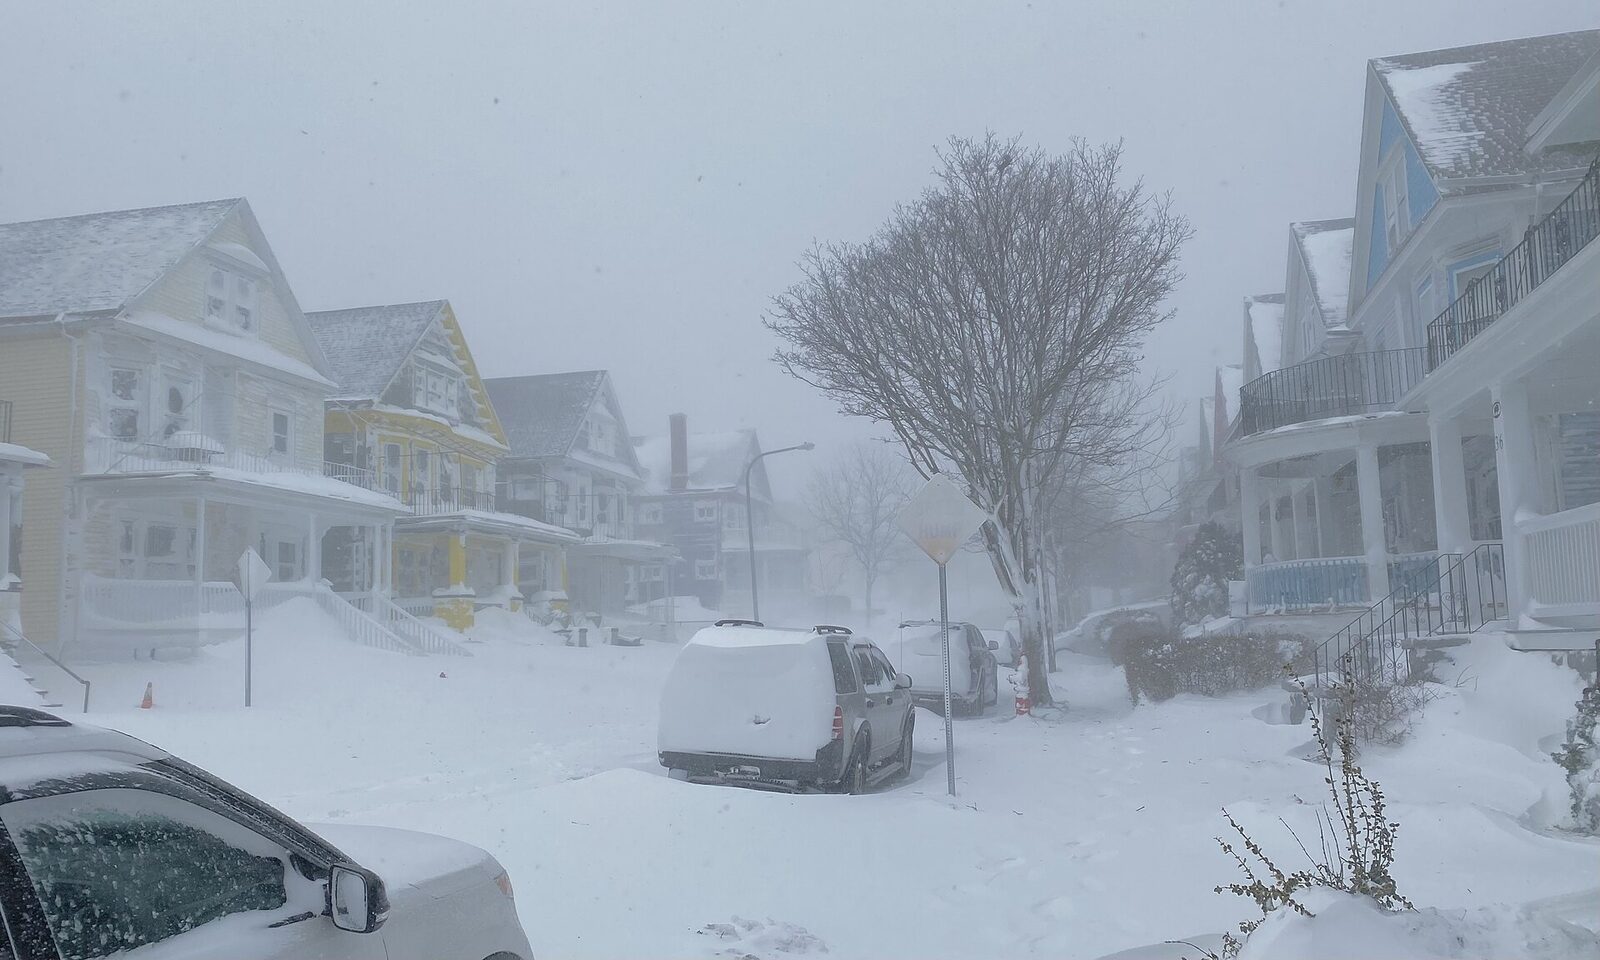
Photo: Andre Carrotflower, CC BY-SA 4.0
PART 3 · LEARN IT · 2 OF 5
Climate
Climate is the usual pattern of weather in a place over a long time, at least 30 years. The smooth line on the Buffalo graph is its climate: the average for each day from 1991 to 2020.
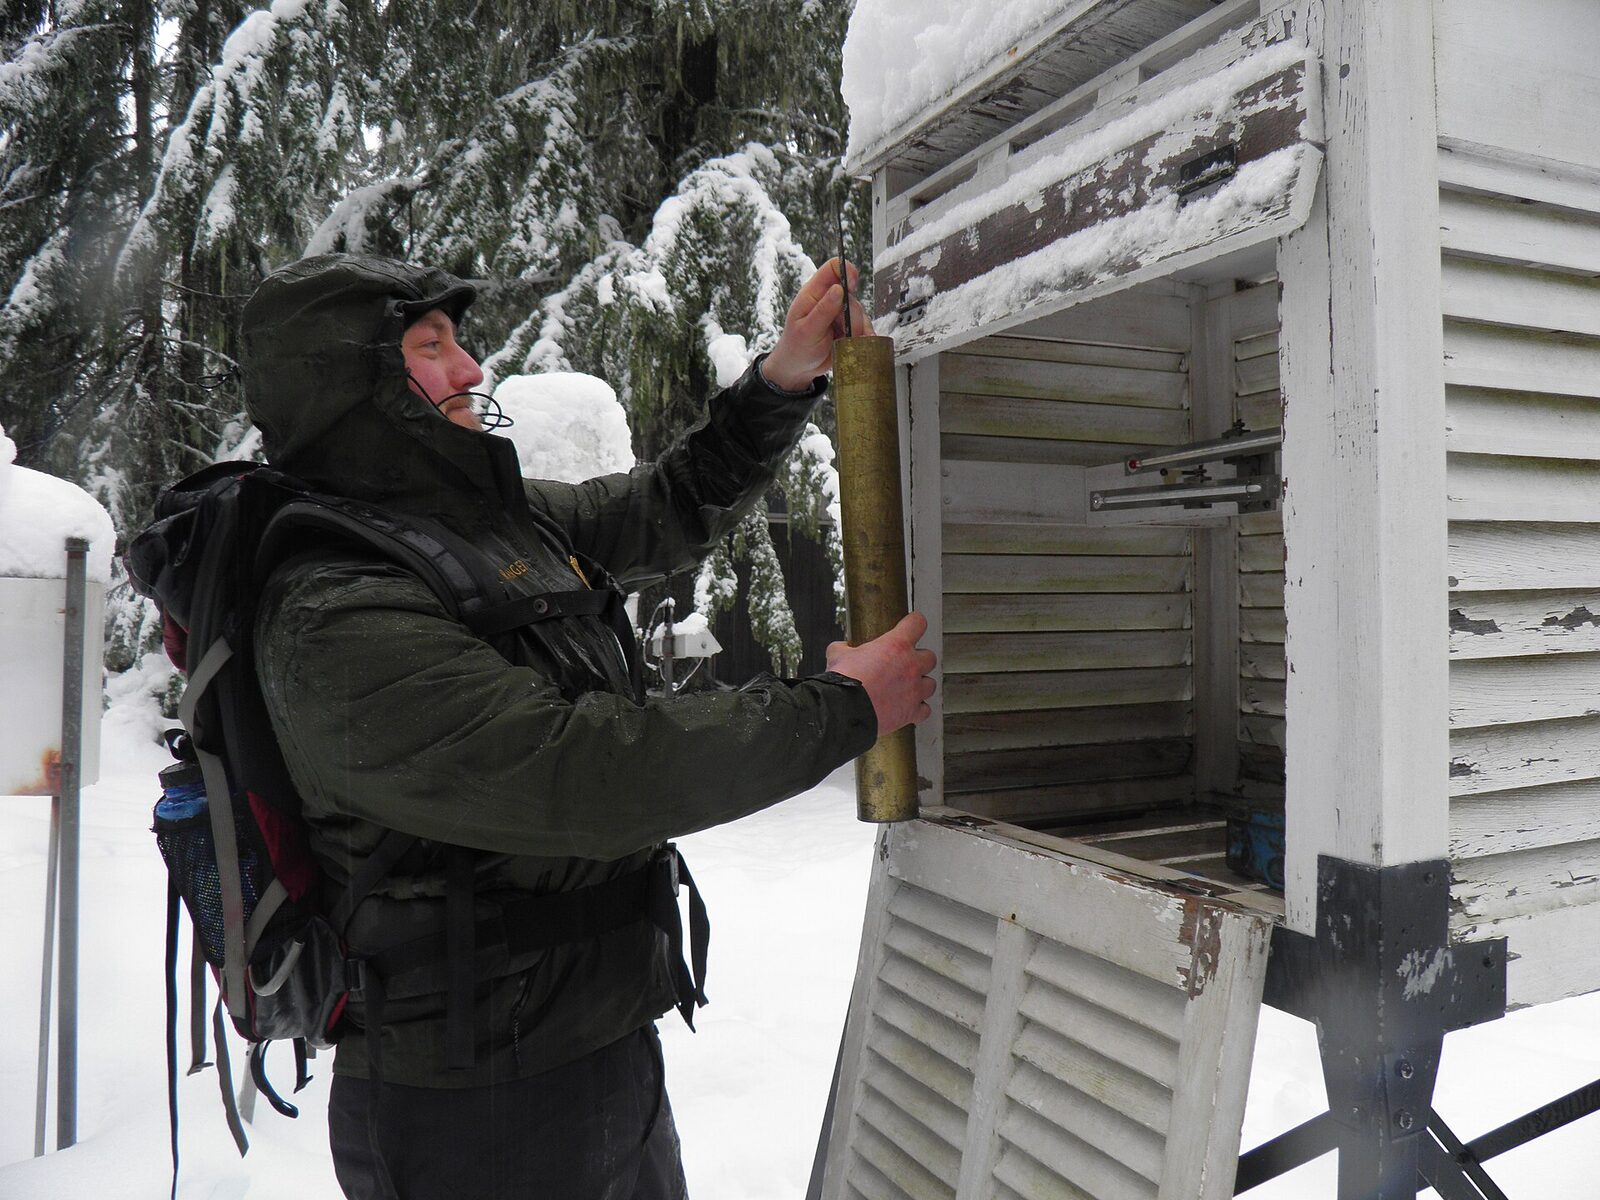
Photo: Mount Rainier National Park, CC BY 2.0
PART 3 · LEARN IT · 3 OF 5
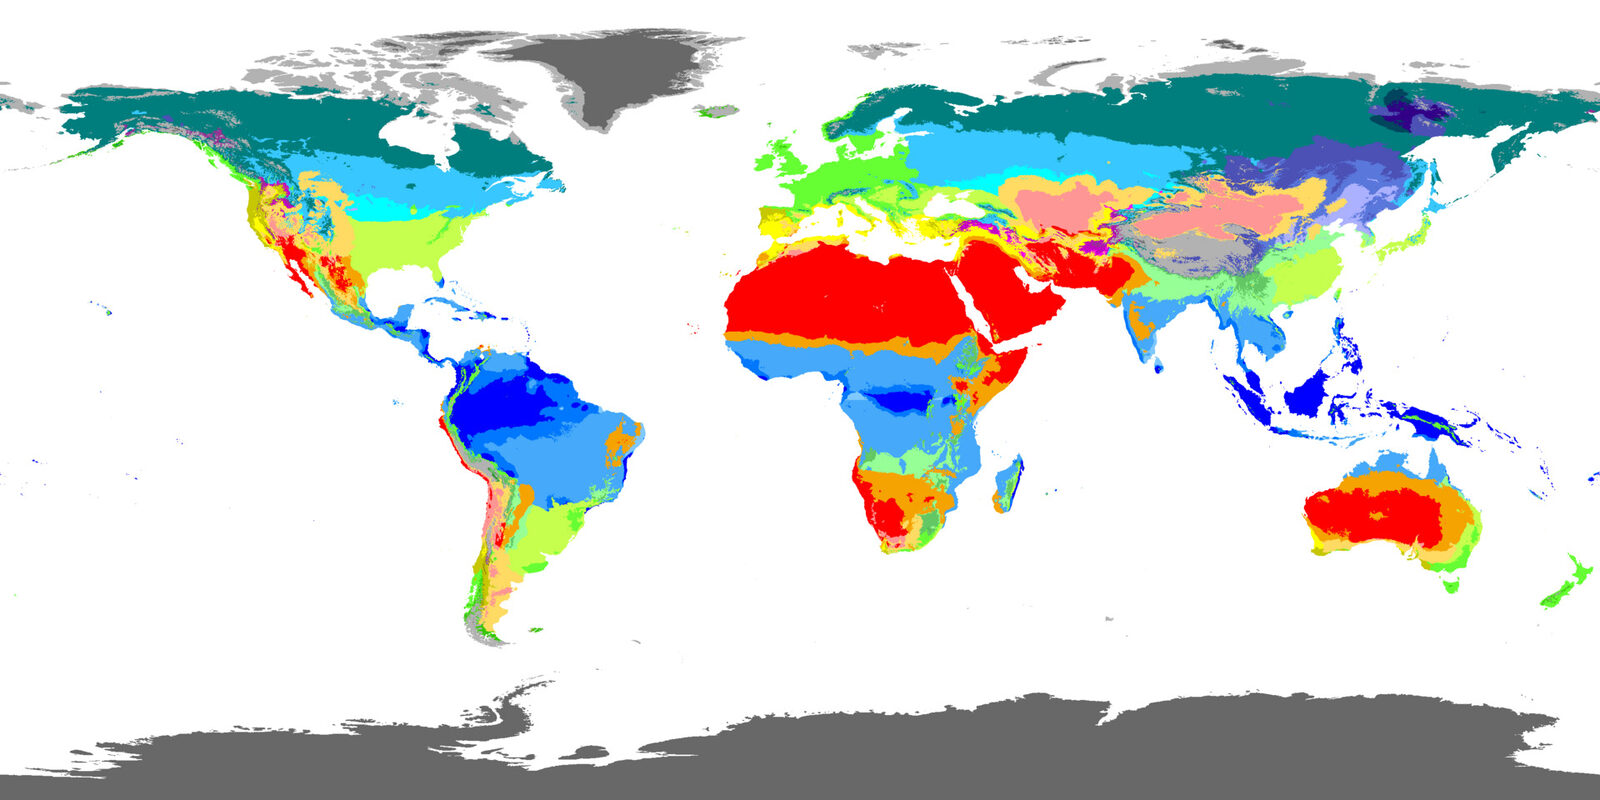
Climate zones
Scientists group places into climate zones. Tropical: near the equator, warm all year. Temperate: in between, with warm summers and cold winters. Polar: near the poles, cold all year, with a short, cool summer.
Map: Beck and others, 2023, CC BY 4.0
PART 3 · LEARN IT · 4 OF 5
The pattern
The lower the noon sun, the colder the year. Farther from the equator, the gap between summer and winter usually grows. That comes from the tilt. Near the poles, the noon sun swings from fairly high in summer to under the horizon in winter.
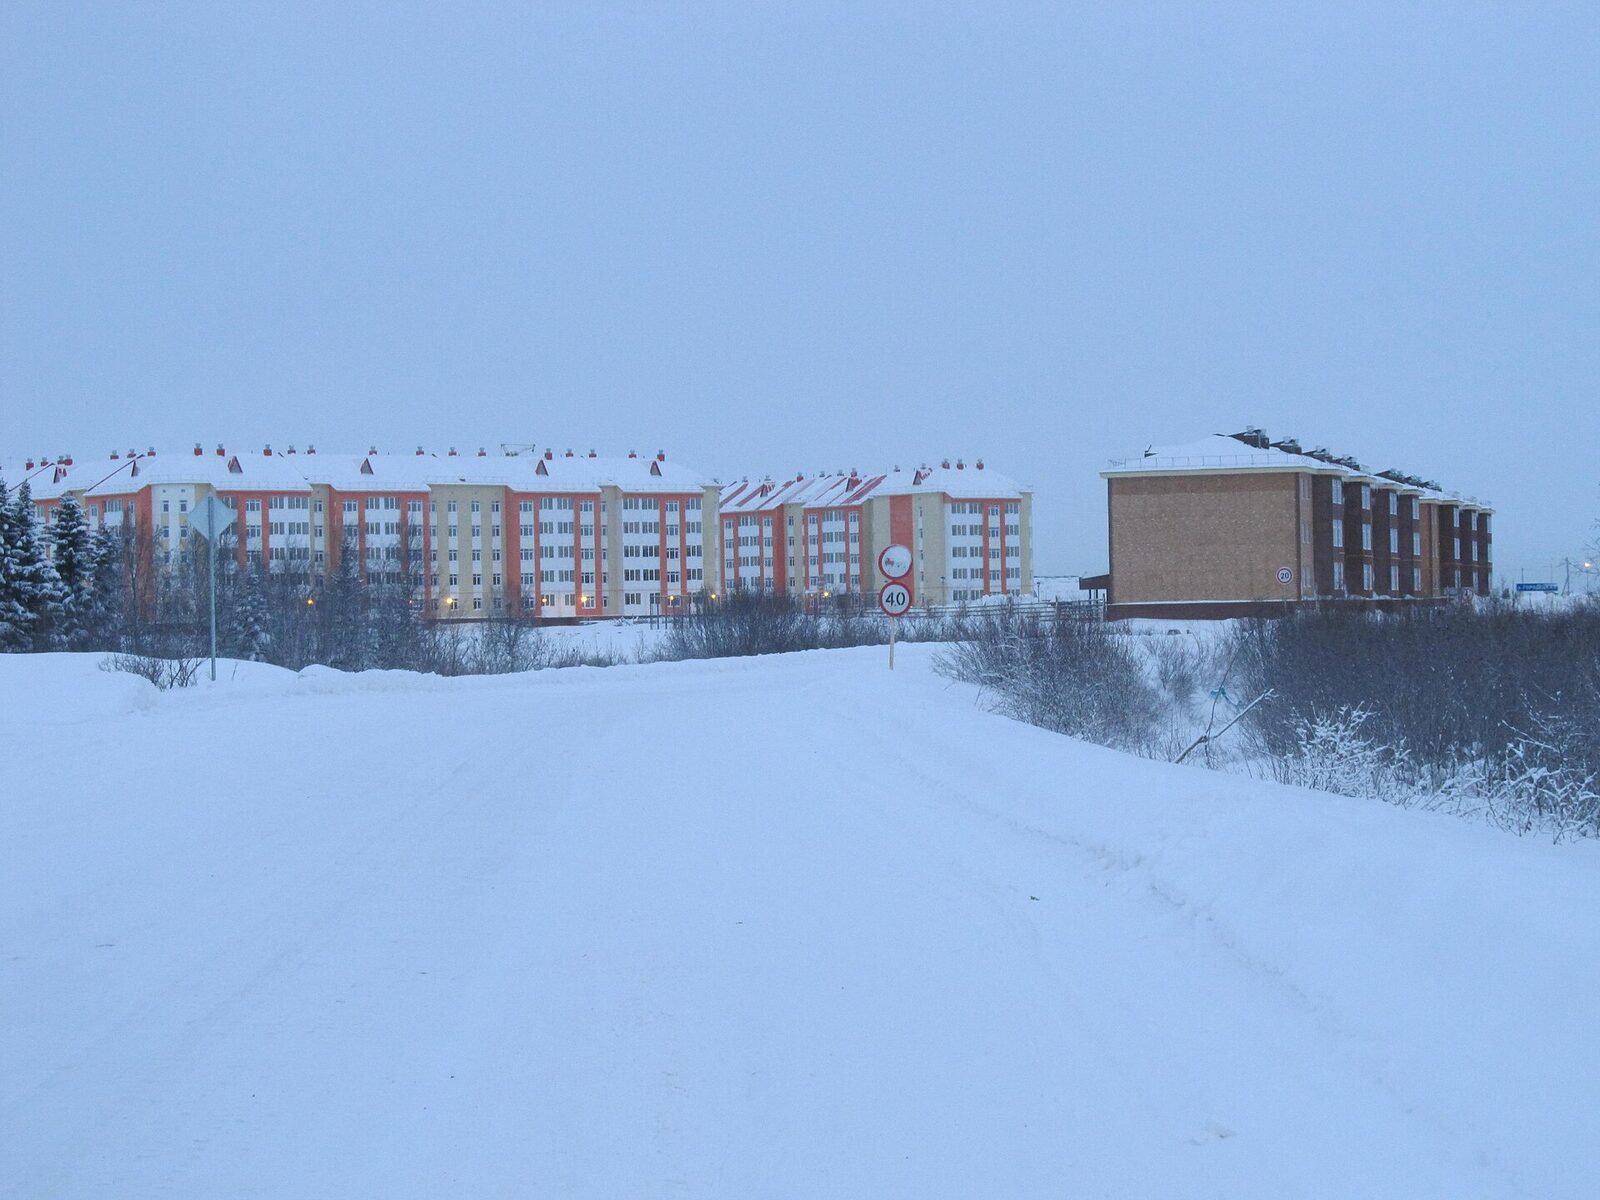
Photo: Lsnmar, CC BY-SA 4.0
PART 3 · LEARN IT · 5 OF 5
The ocean evens it out
Anchorage sits right next to the ocean. Water warms up and cools down slowly, so it keeps nearby land from getting very hot or very cold. Buffalo is farther from an ocean, so its gap is bigger.
Photo: Zaereth, public domain
PART 3 · QUESTION 14
Weather or climate?
Row 1
It was 62.5°F in Buffalo on March 19, 2025.
Row 2
Buffalo averages 48.8°F a year.
Row 3
Singapore is warm all year.
Tick weather or climate in each row. Then write the climate zone for Singapore, Buffalo and Utqiagvik.
ASK YOURSELF
One day, or many years?
One day or one week is weather.
An average over 30 years is climate.
Look for the climate zones on the map in the lab, too.
PART 3 · QUESTION 15
Predict Houston
1
Houston, Texas has a noon sun of 60° in March.
2
Find the cities on the graph with a noon sun close to 60°. Use them to predict.
3
Write your prediction on the worksheet first.
4
In Predict Houston, set the slider and press Lock in and check.
5
Write the real average. Which cities did you use, and why?
WRAP IT UP · QUESTION 16
Is it the distance?
The claim
“The poles are cold because they are farther from the sun.”
Part 1 or 2
Pick one number. Squares lit at a low angle work well. So do Buffalo’s distances in January and July.
From Part 3
Pick one number from your Question 12 table.
Reasoning
Argue against the claim. Say what really makes the difference.
Noon in December in an Arctic town. The sun has not come up.
Photo: Lsnmar, CC BY-SA 4.0
WRAP IT UP · BACK TO THE START
Revisiting the Phenomenon
Why does the same sun make such different climates?
1Using evidence from today, explain why Singapore is warm all year and Utqiagvik is frozen most of the year.
2The same sun shines on both beaches. Why does each square meter in Utqiagvik get less energy?
3How does Earth’s tilt explain Utqiagvik’s short summer and long, dark winter?
4Which numbers from your worksheet best support your explanation?
Photo A: Singapore, near the equator.
Photo B: Utqiagvik, Alaska, at 71° N.
Photos: Mike Peel (mikepeel.net), CC BY-SA 4.0 · Andrei, CC BY 2.0

LAST CHECK
Before you hand it in
Name, date and period are on top.
All four tables are full.
Question 14 has one tick in each row.
Every claim uses numbers from your own tables.
Photo: Lisa Hupp, U.S. Fish and Wildlife Service, public domain